Survey: Tree Growth
Tree growth surveys should use consistent cadence and plot logic so time-series trends remain reliable.
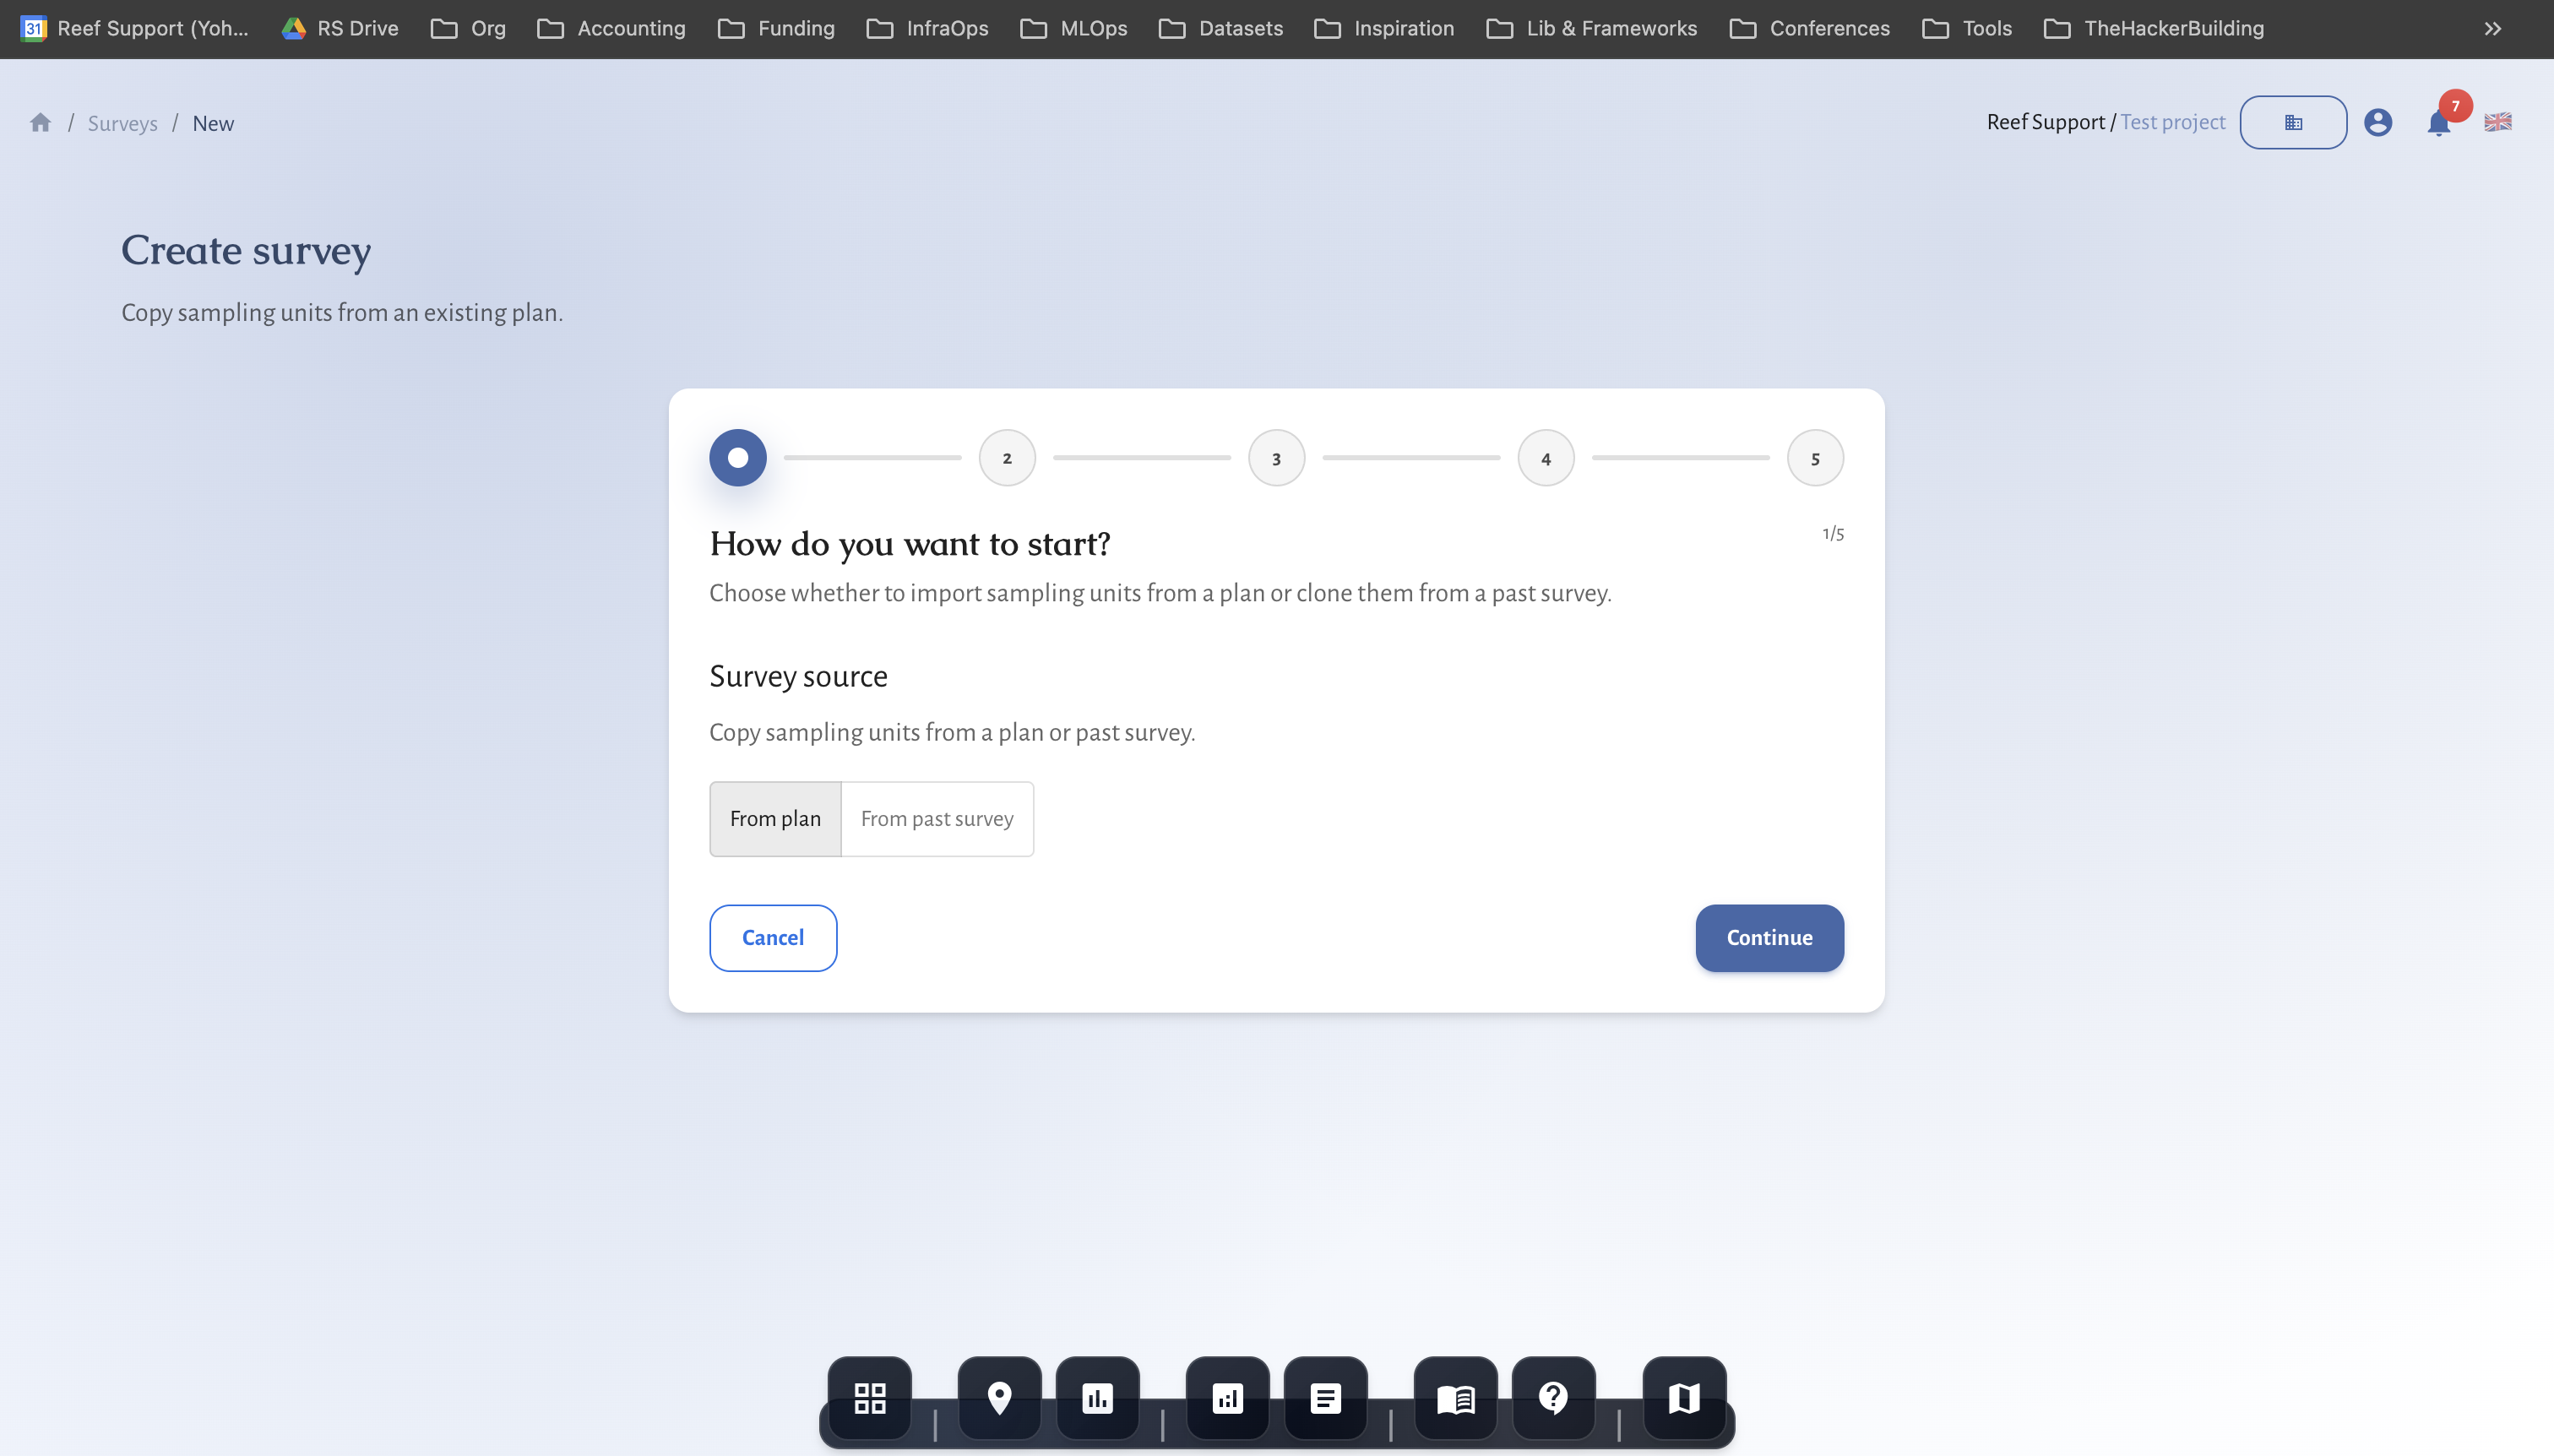
Setup
- Create survey from an approved tree growth plan.
- Confirm area and cohort context.
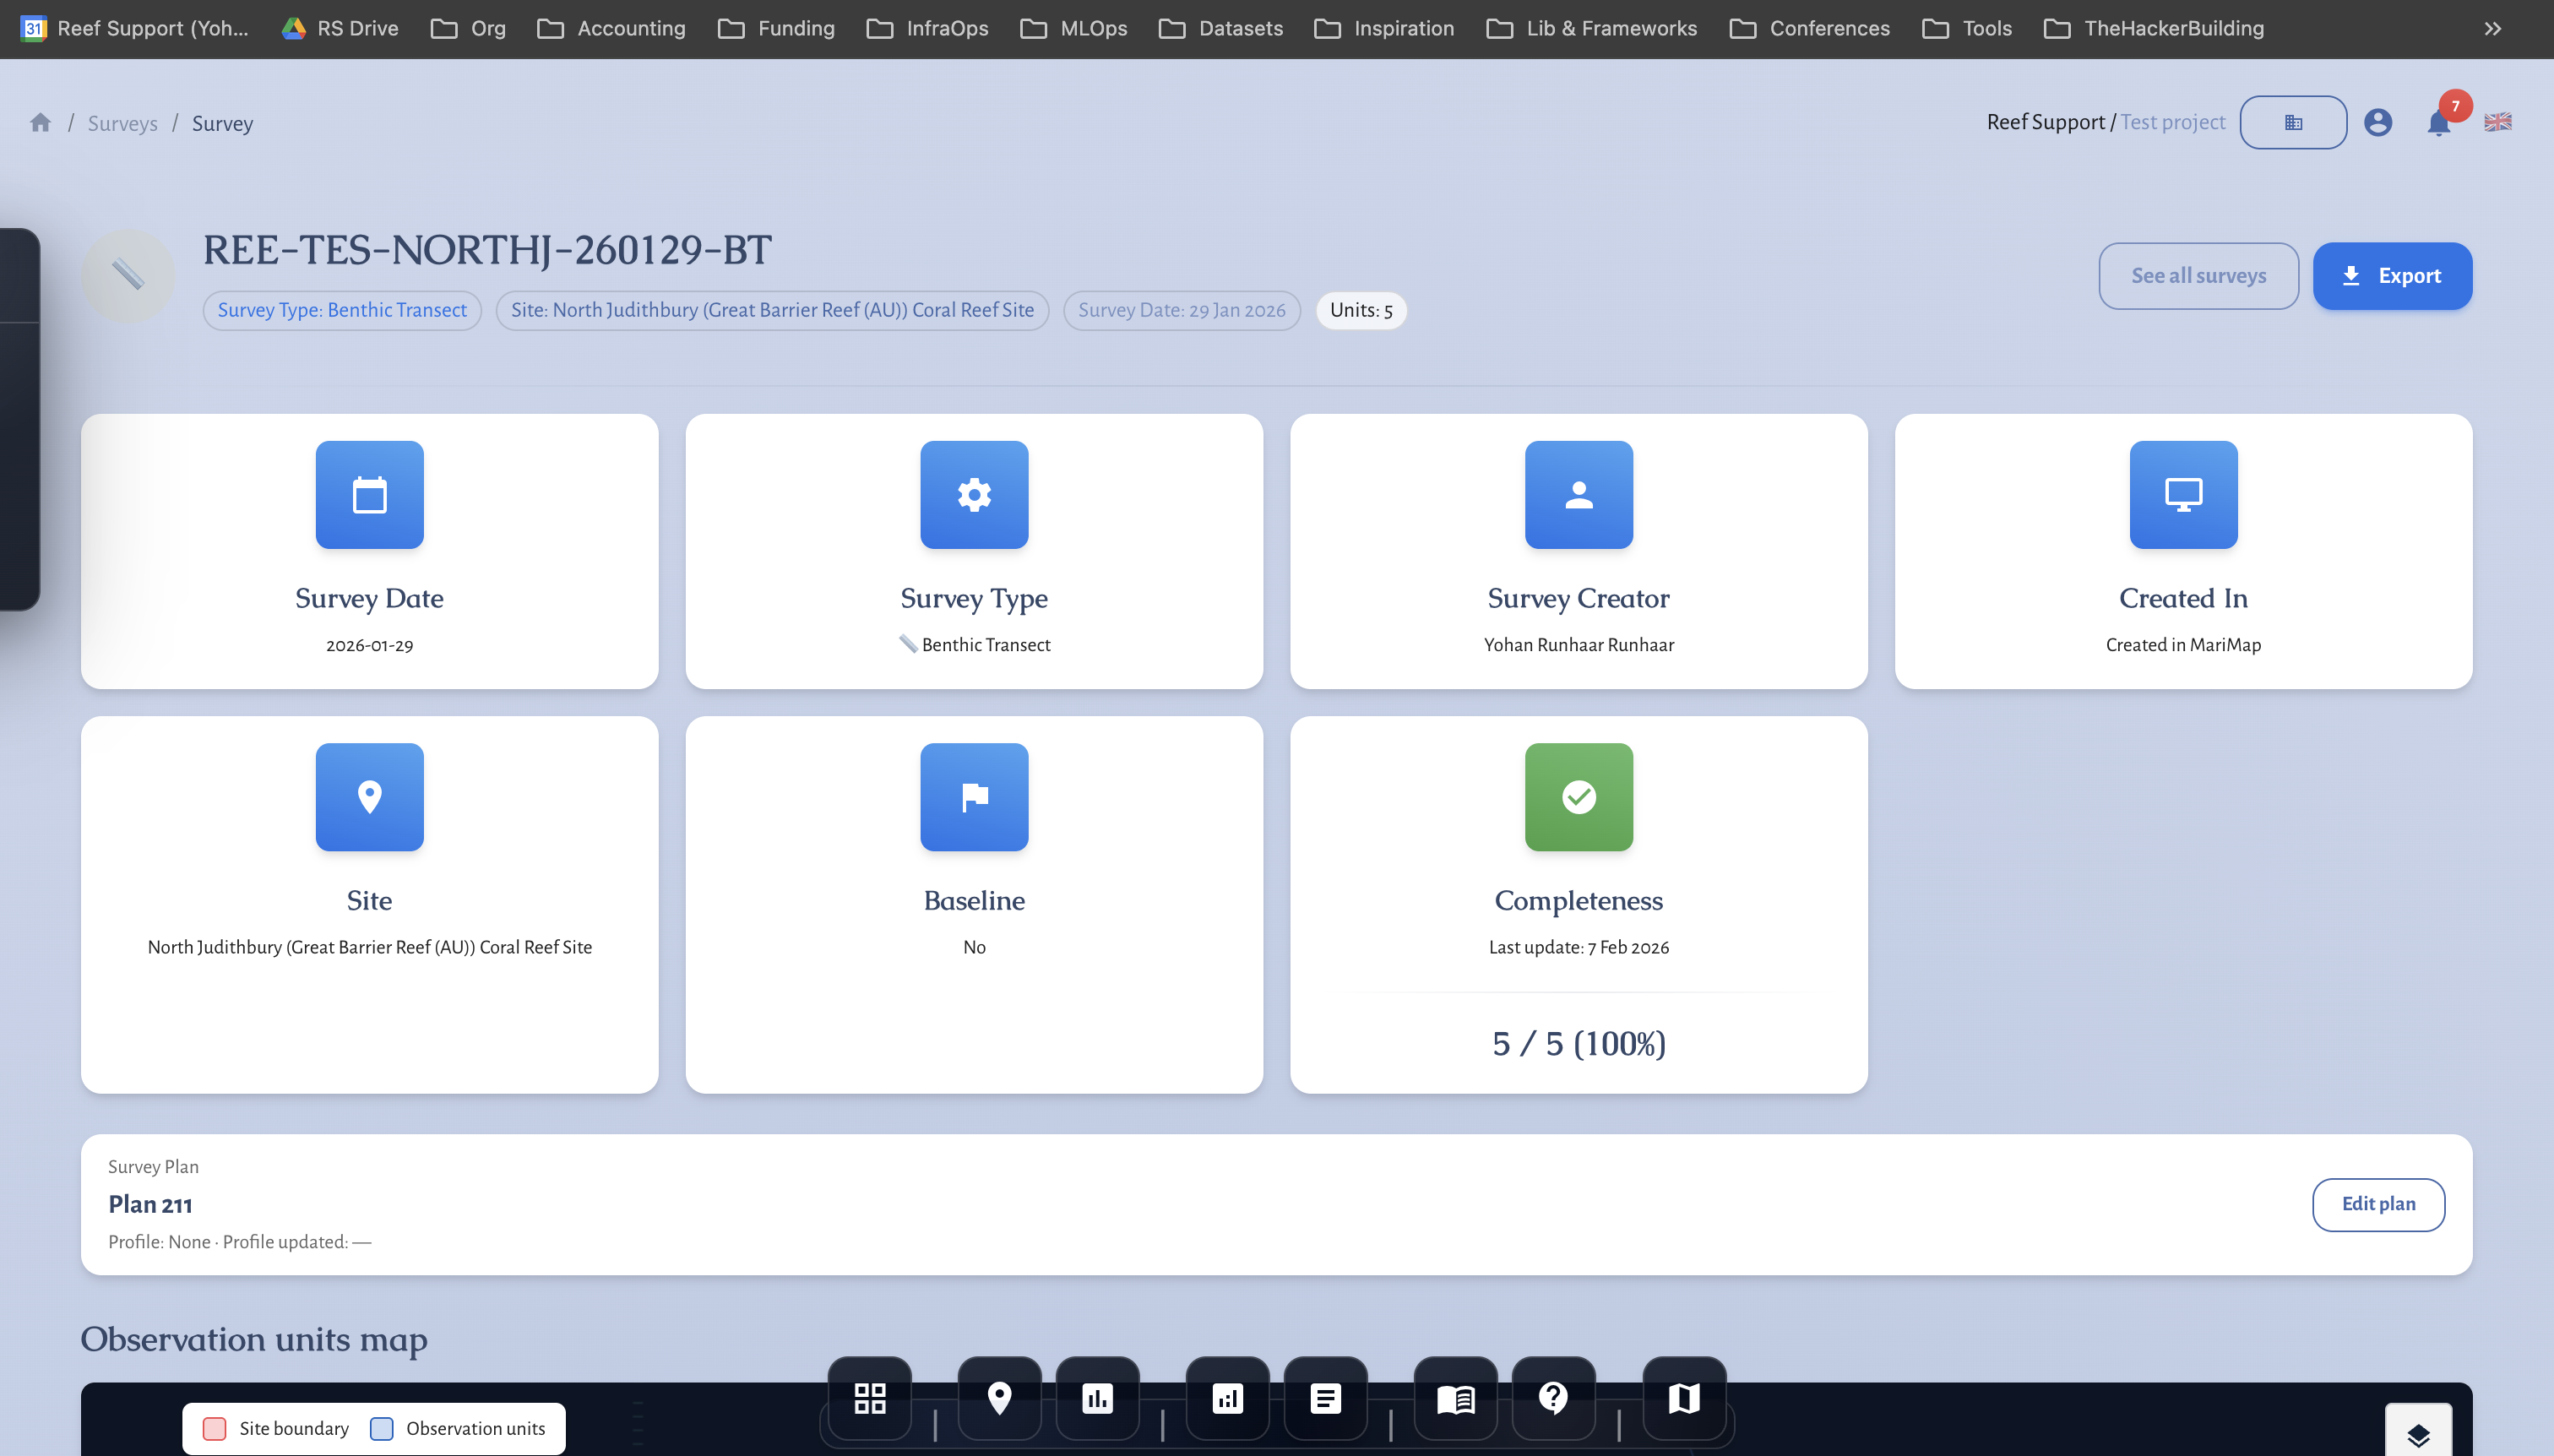
Record growth data
- Add measurements in the survey workspace.
- Confirm units and date stamps before submit.