Survey: Fauna Observation
Fauna observation quality depends on clean species identification, timestamp accuracy, and location consistency.
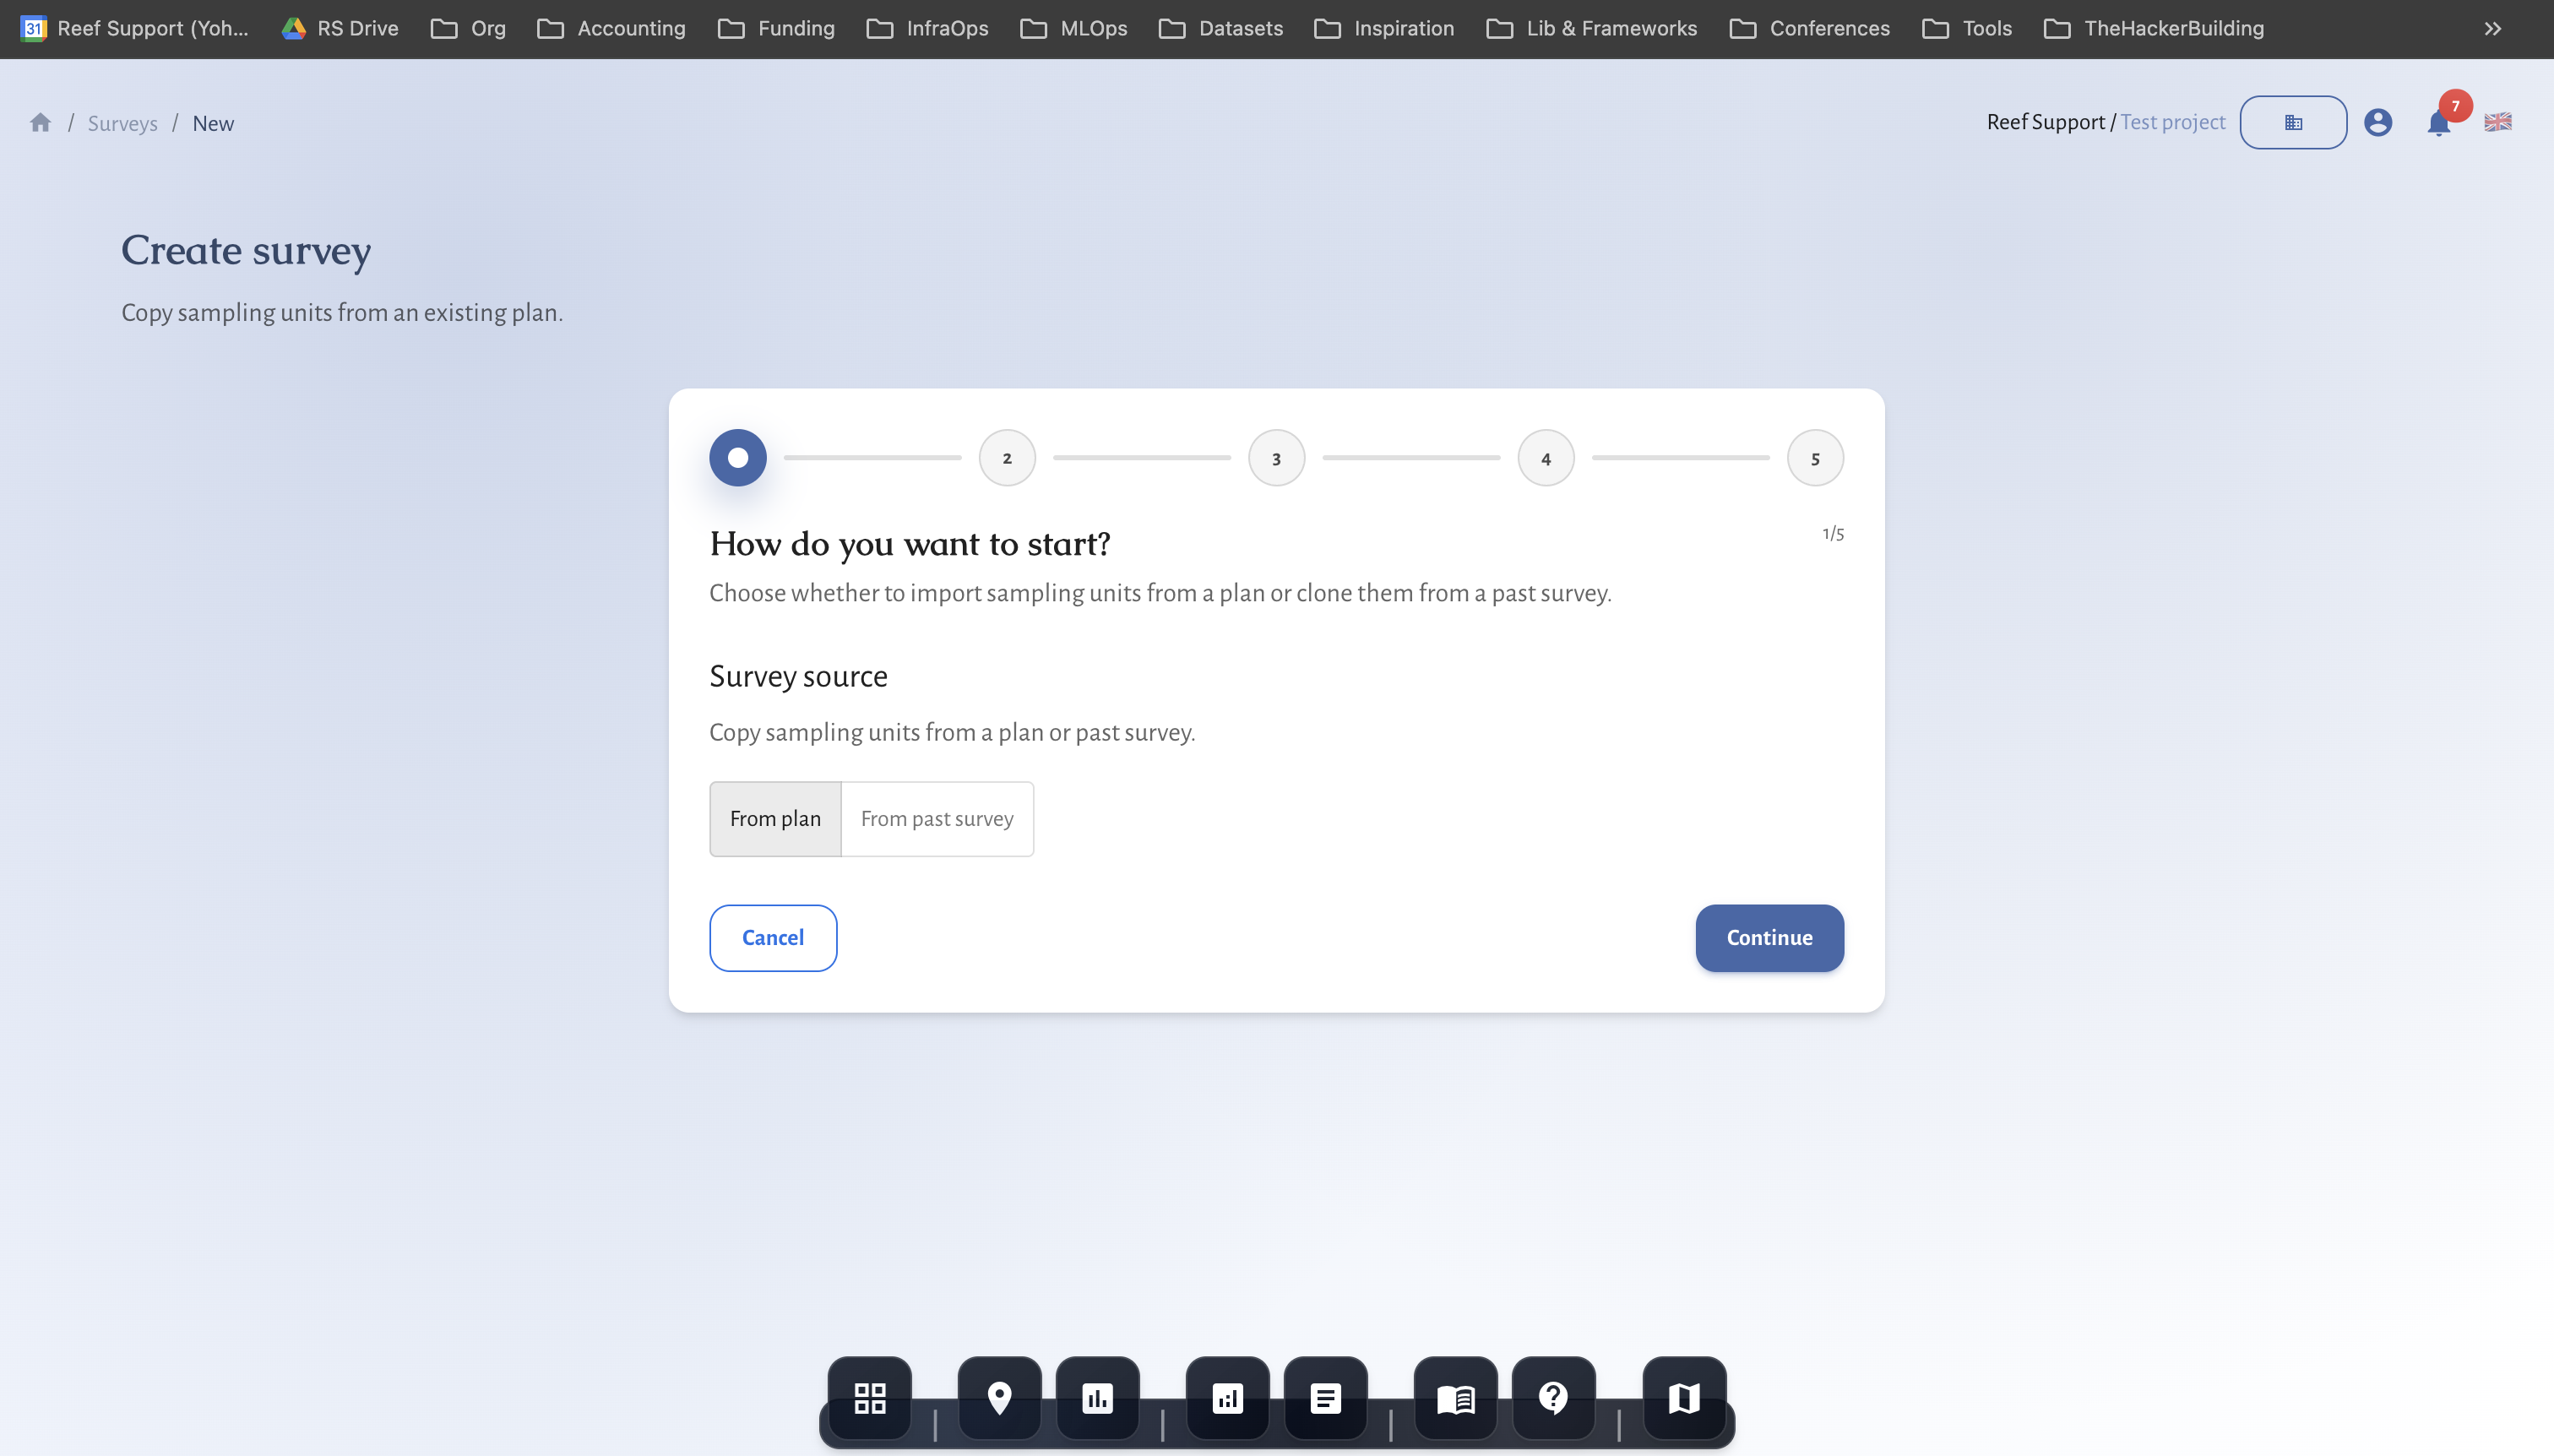
Setup
- Create survey from fauna observation plan.
- Confirm site and observation window.
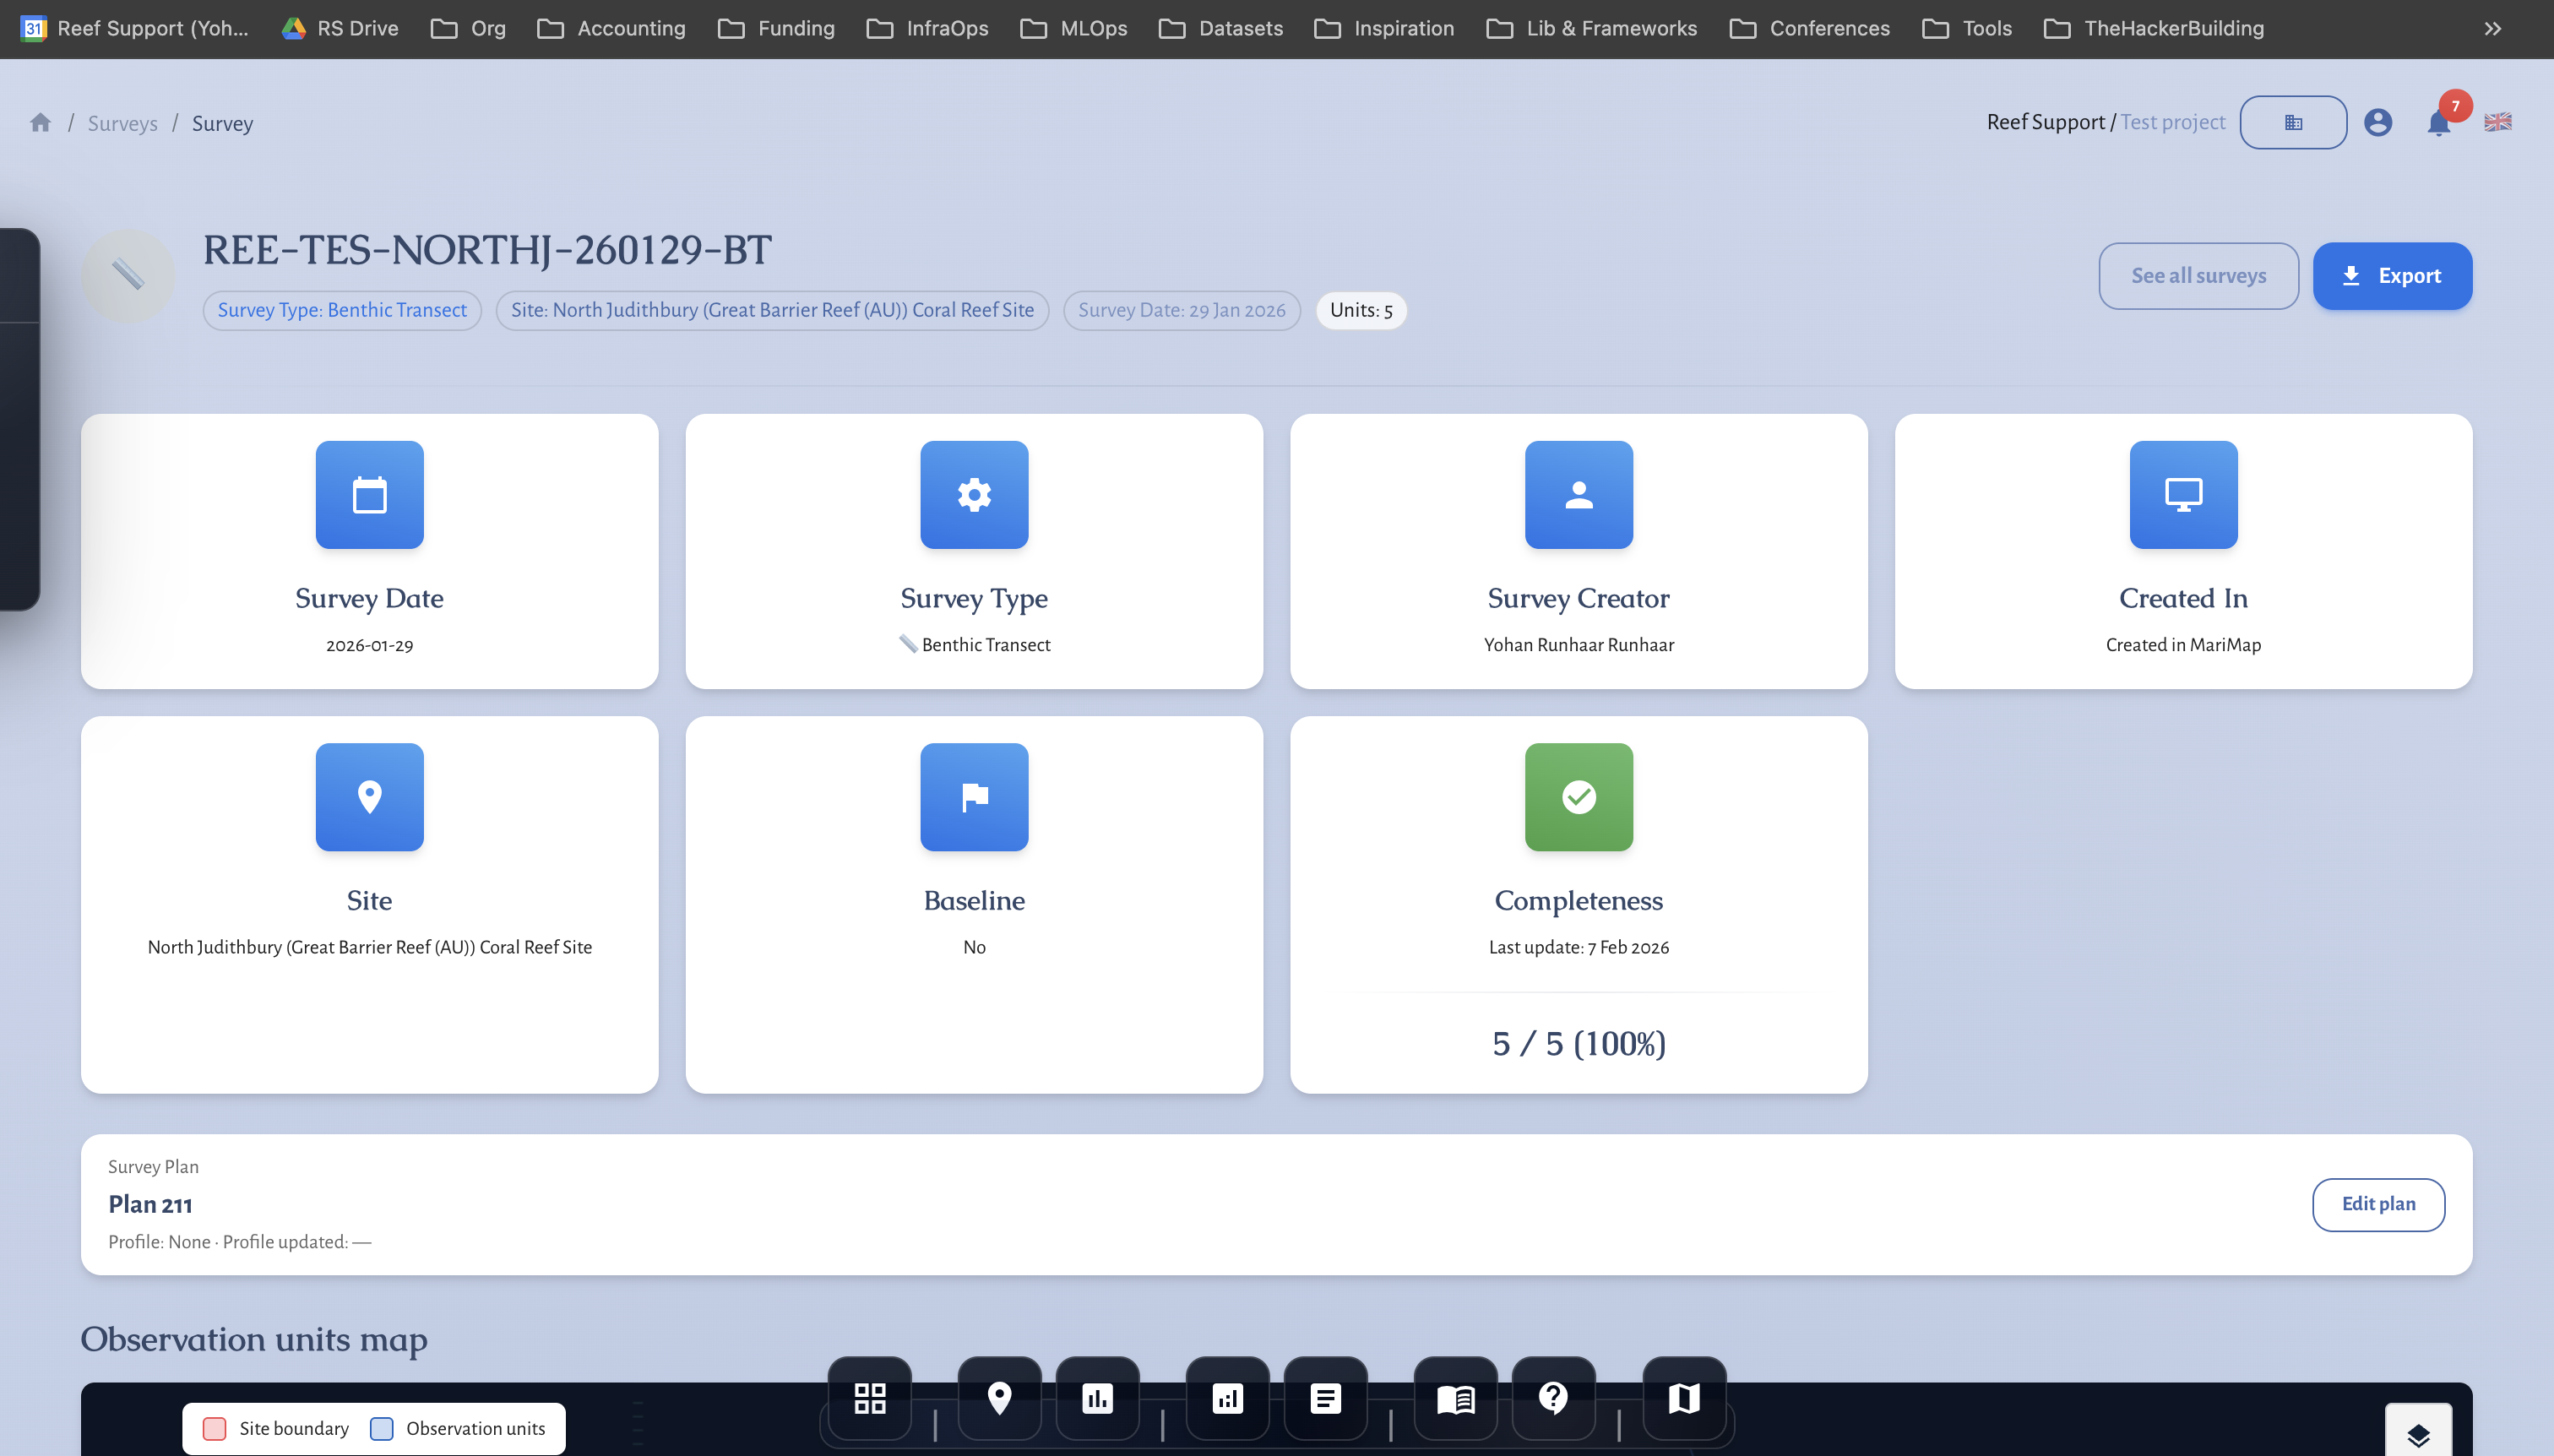
Observation entry
- Add each record with category and evidence.
- Validate records in the survey detail view.