Getting Started with MariMap
MariMap is a marine conservation platform that connects projects, sites, surveys, and reporting in one workspace. Start by selecting your organization, creating a project, and adding a site boundary so the map, surveys, and analytics all point to real places. From there you can plan surveys, collect field observations, and review environmental context in Analytics.
At a glance
- MariMap organizes work as Organizations → Projects → Sites → Surveys.
- Projects set the reporting context; sites define your real monitoring locations.
- Surveys and survey plans keep field protocols consistent across teams.
- Analytics combines survey results with satellite context.
- Reports summarize surveys for funders, regulators, and partners.
Before you start
- Confirm you have access to the correct organization.
- Decide which ecosystem or facility type you are monitoring (coral reef, seagrass, mangrove, or restoration facility).
- Prepare any existing site boundaries (GeoJSON or KML) if you already have them.
- Agree on naming conventions for projects, sites, and survey plans.
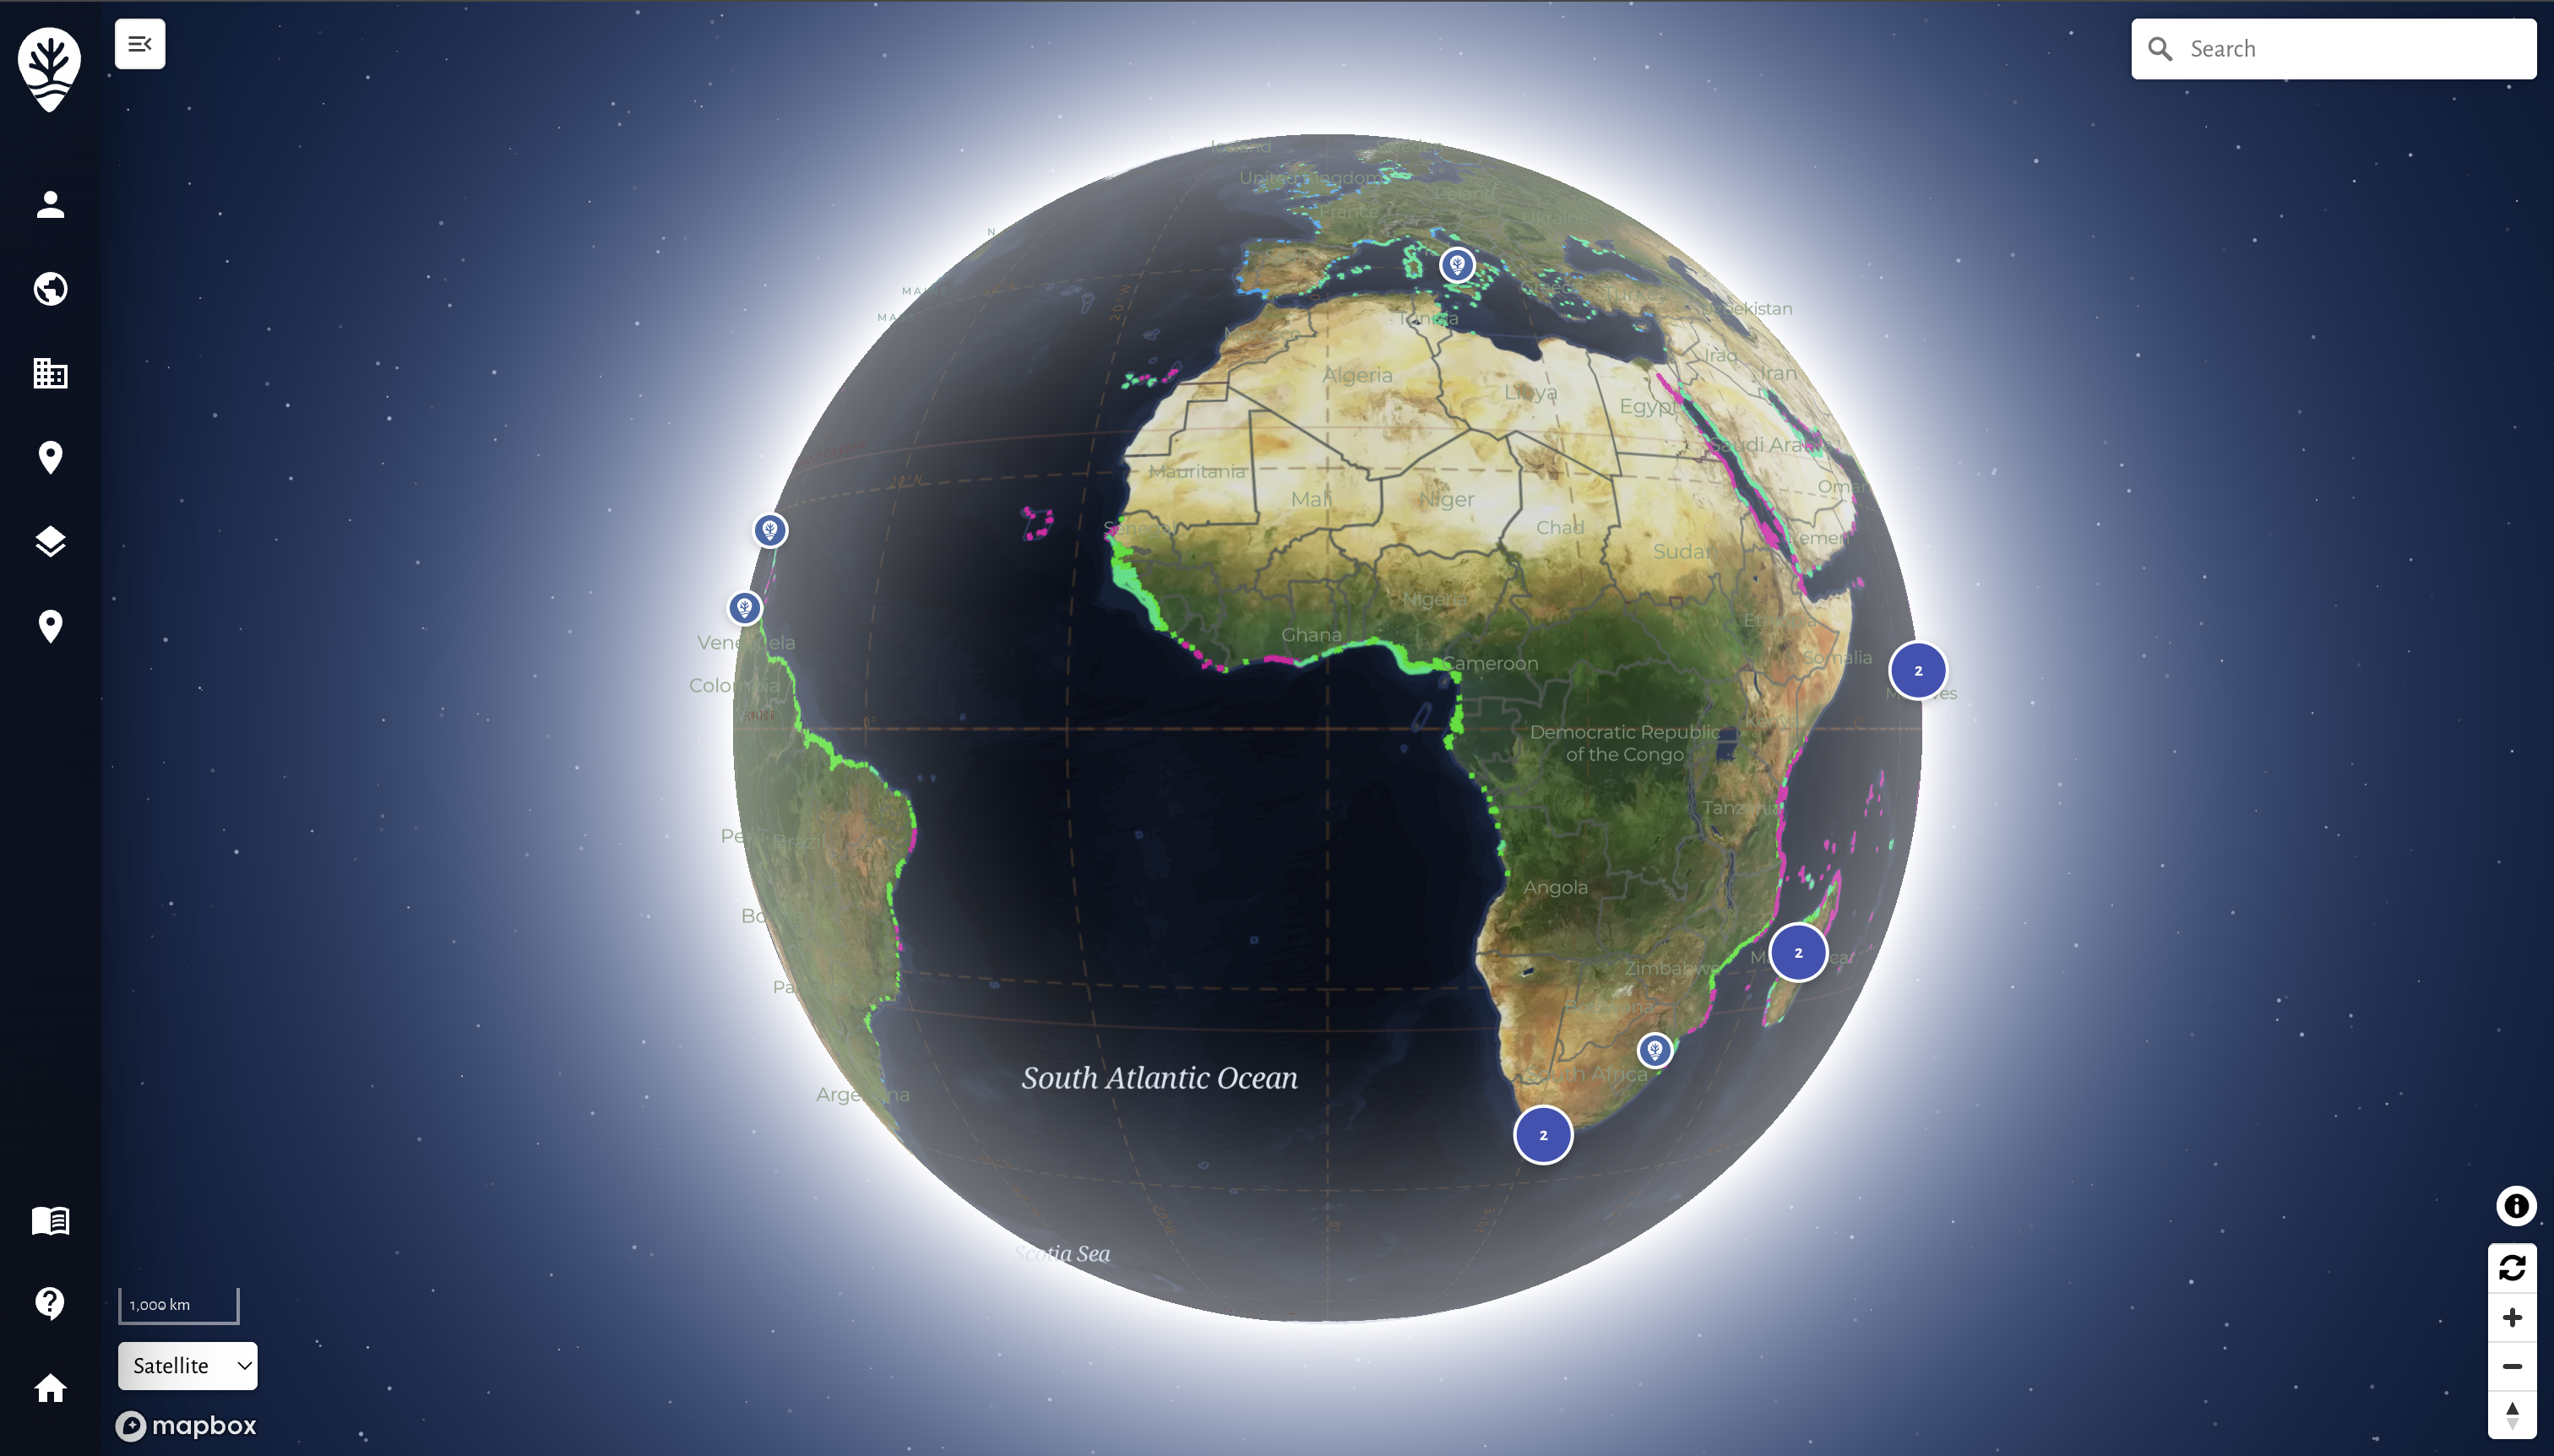
How MariMap is organized
MariMap keeps marine conservation data connected in a clear chain: organizations contain projects, projects contain sites, and sites contain surveys. Reports pull from those surveys and keep methods, metadata, and maps together. This structure is the backbone of the platform and makes multi-site monitoring consistent.
Step-by-step in MariMap
1) Select your organization and project
- Sign in and open the app workspace.
- In the top bar, open the organization and project selector.
- Choose the organization you are working in.
If this is your first time, you may only see a personal organization. You can create a new organization before creating projects.
2) Create an organization (if needed)
- Open the organization list from the selector.
- Choose Create new organization.
- Enter the organization details and save.
Organizations control team access. Admins can invite teammates and manage roles later.
3) Create your first project
- Open the project list from the selector.
- Click Create project.
- Complete the steps:
- Basics: name the project and add a short description.
- Focus & reporting: select the project focus and reporting audience.
- Funding (optional): record funding type and key funders if needed.
- Review: confirm details and create the project.
Projects are the reporting container for all sites and surveys. Use clear names such as “Bonaire Coral Restoration 2026” or “Mediterranean Seagrass Monitoring”.
4) Add your first site
- Open Sites from the left navigation.
- Click Create site.
- Choose the site category:
- Ecosystem for coral, seagrass, or mangrove monitoring.
- Facility for restoration nurseries or labs.
- Select the site type (Coral reef, Seagrass, Mangrove, Coral nursery, Coral lab).
- Add the site name, country, and optional site ID.
- Draw the site boundary on the map or upload GeoJSON/KML.
- Review and create the site.
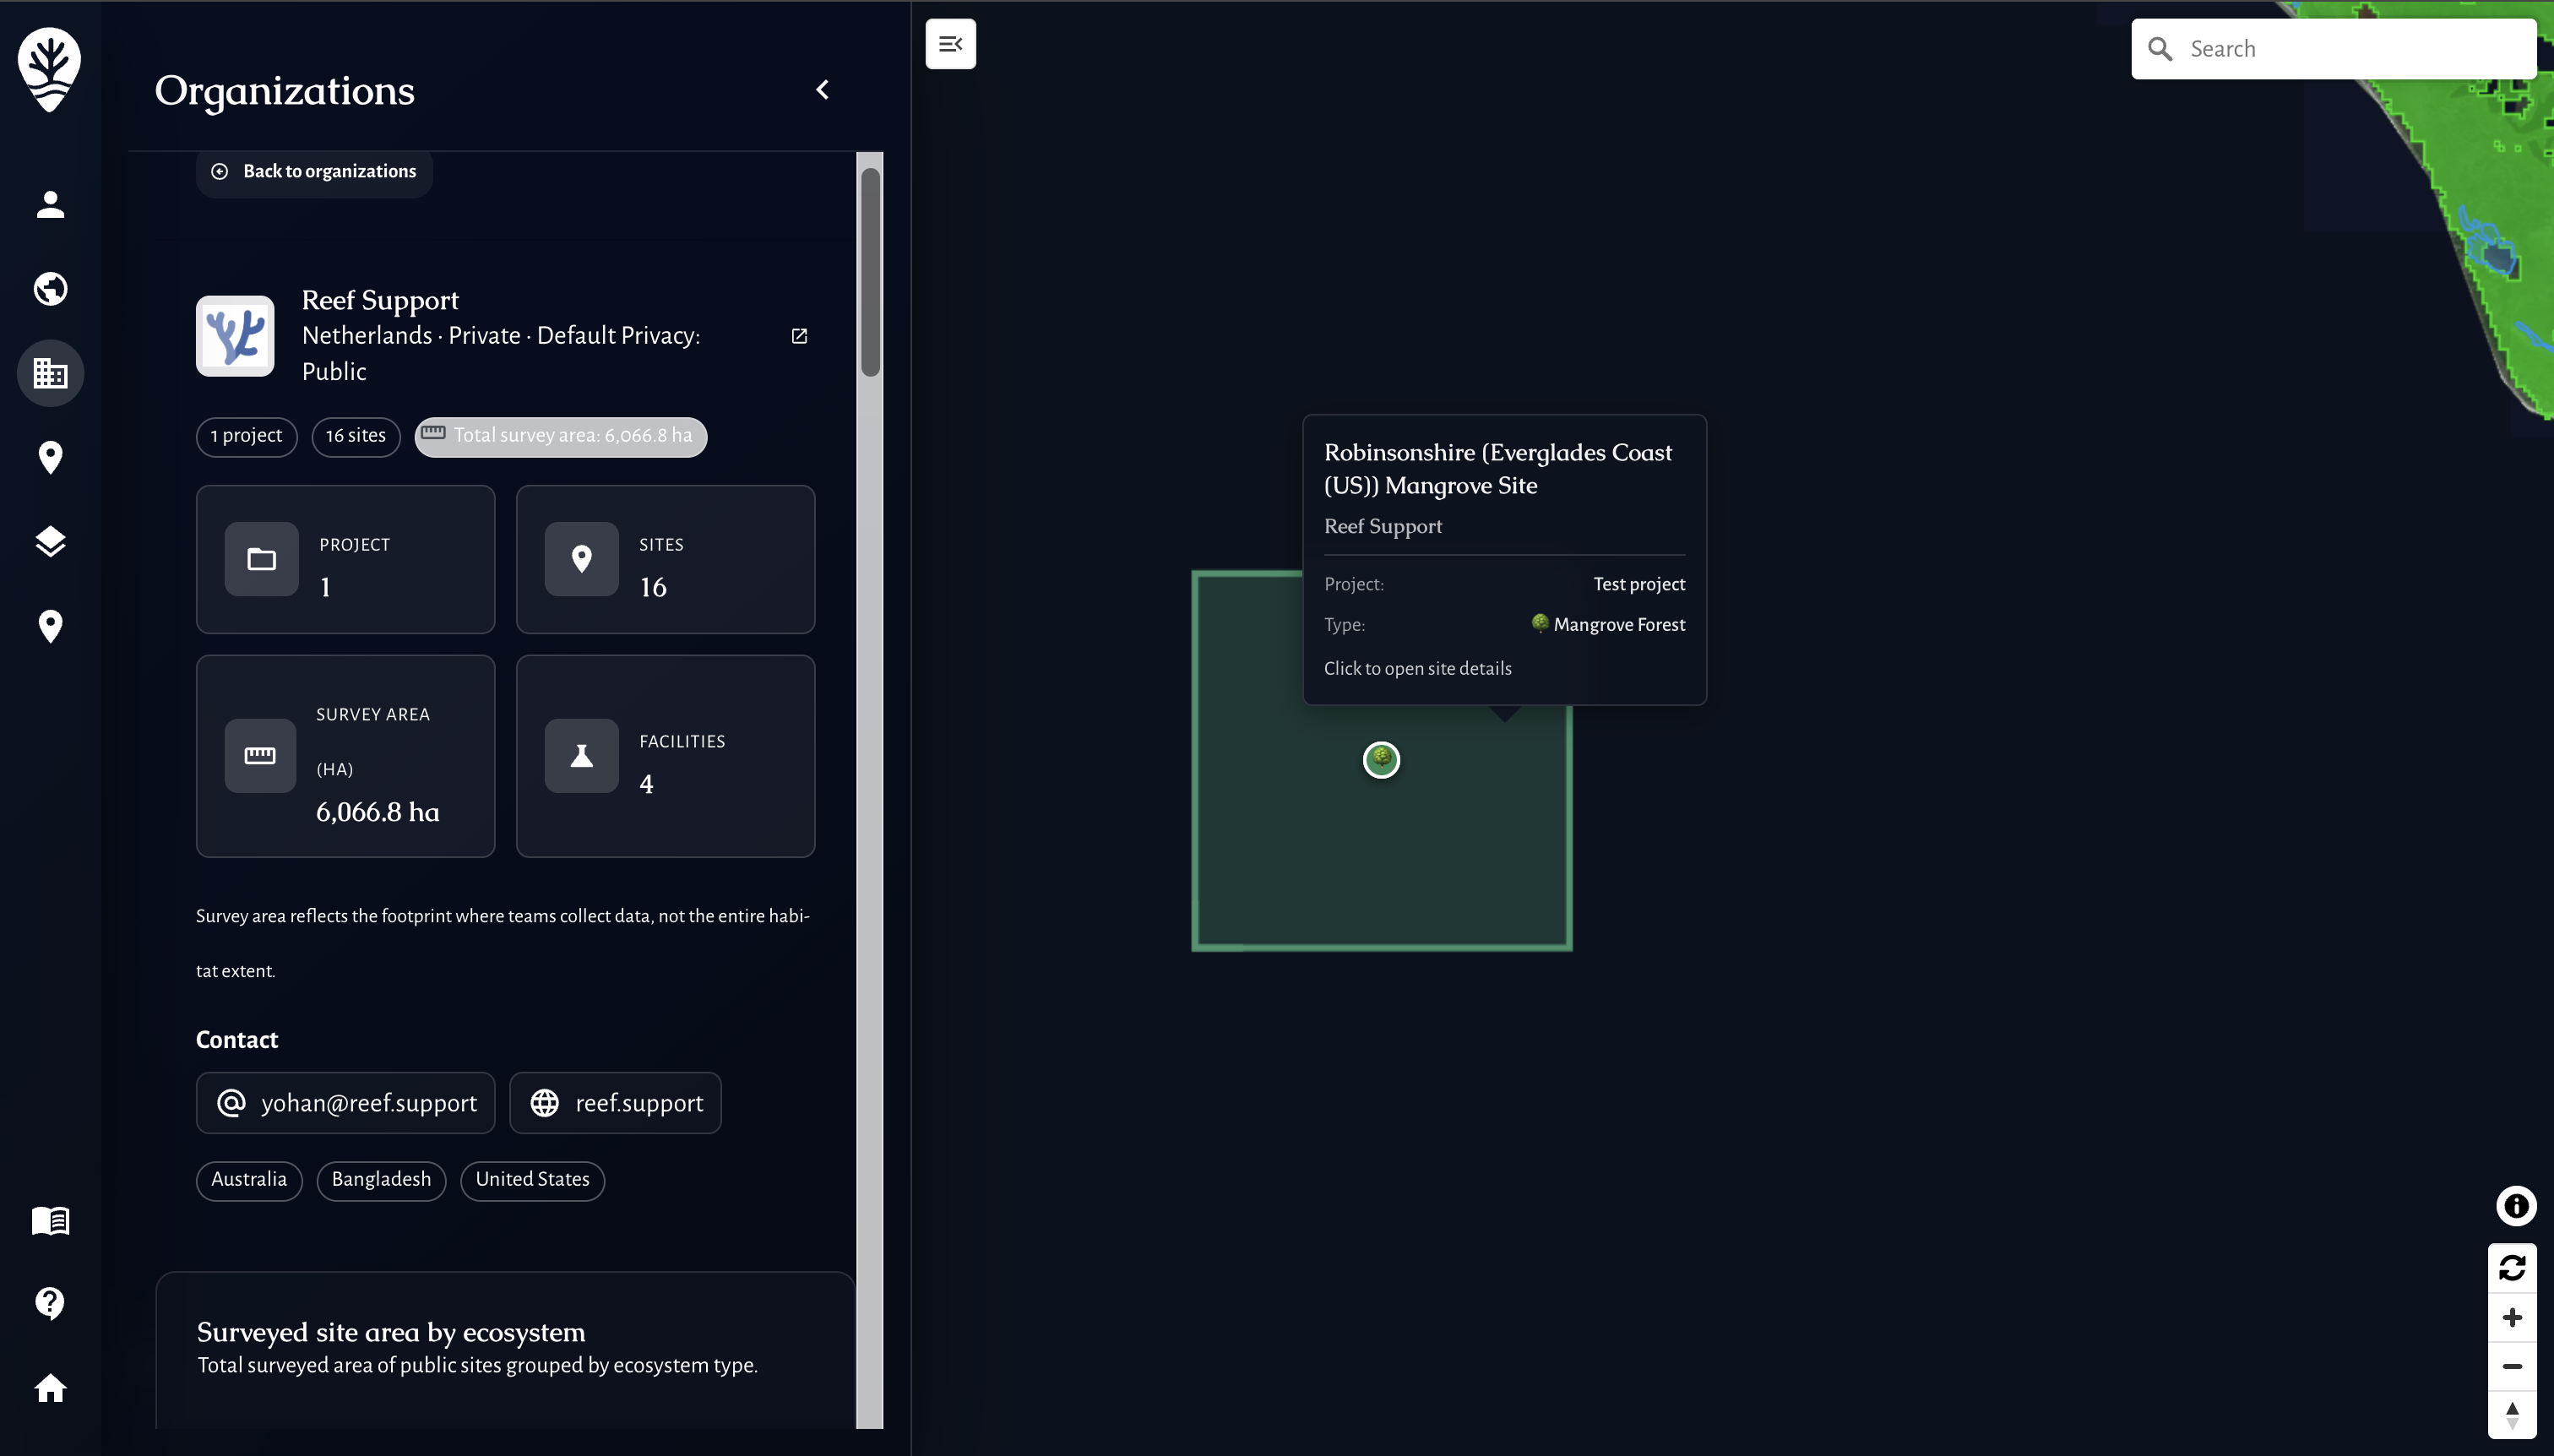
The site boundary is essential for GIS context, satellite overlays, and repeat survey geometry.
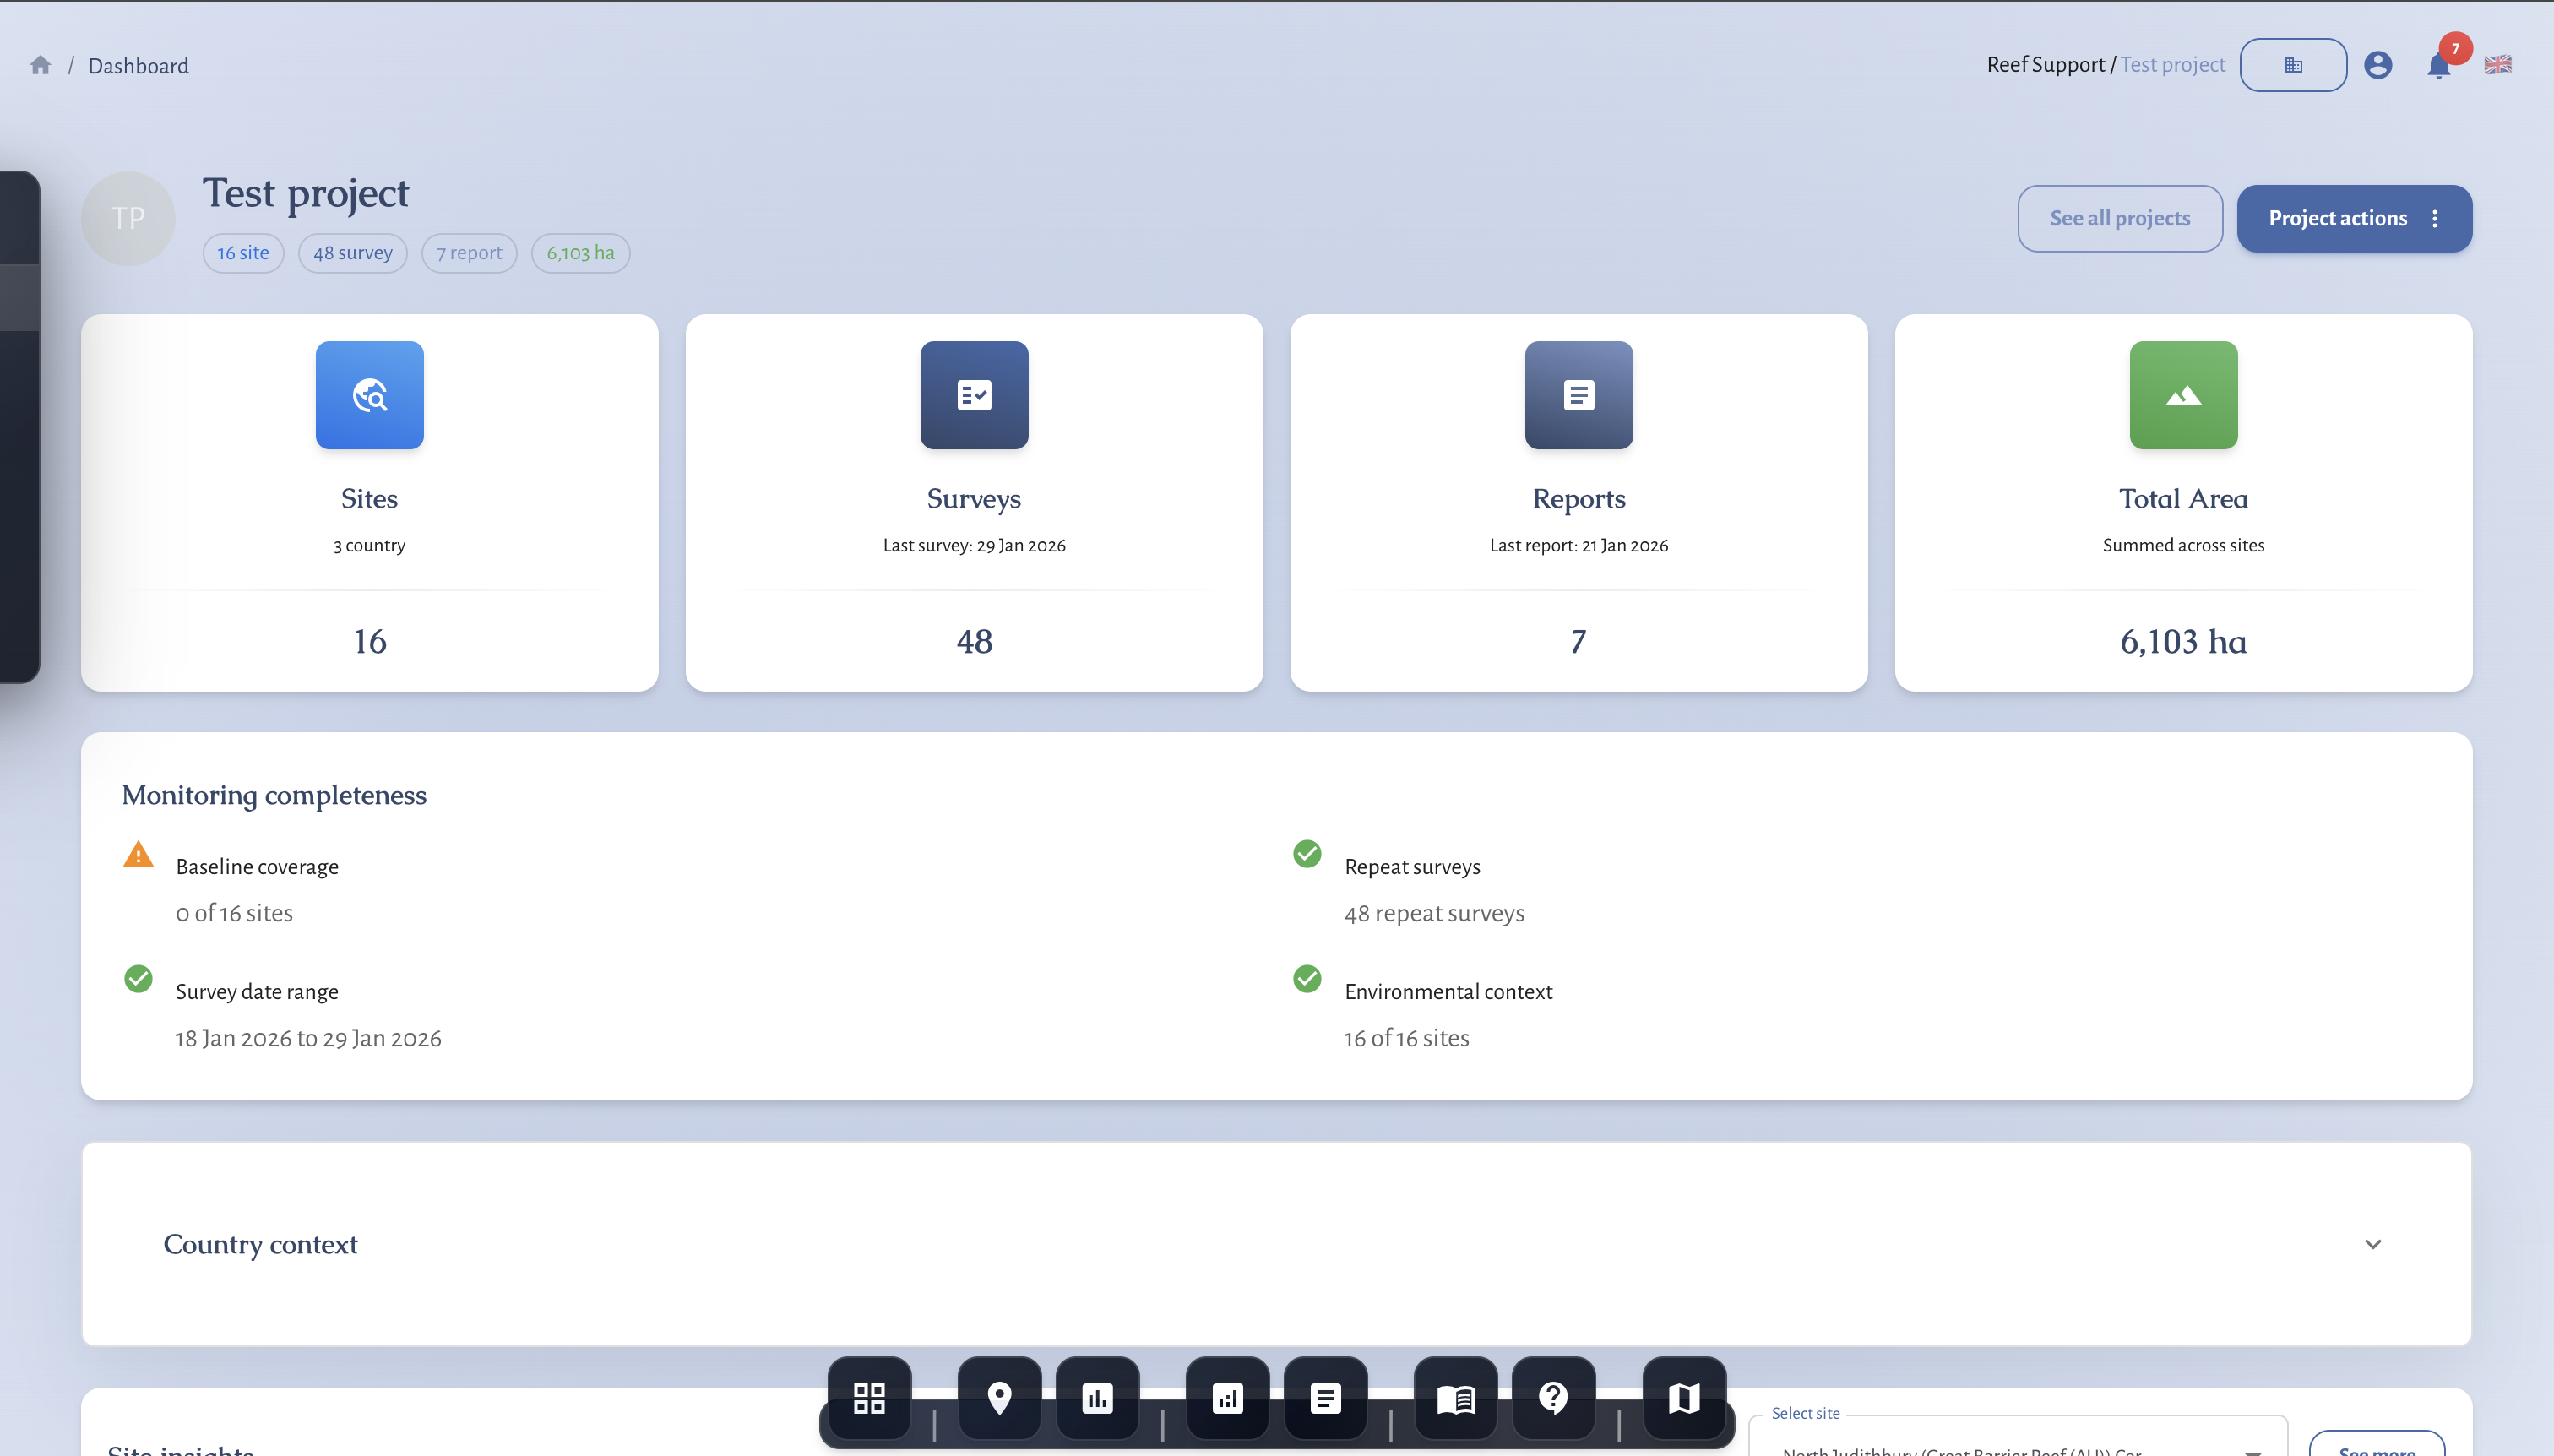
5) Check the site profile
Open the site from the Sites list. Confirm that the boundary, site type, and metadata match your monitoring footprint. If you need to adjust later, use Edit site from the site view.
6) Create a survey plan
- Go to Surveys and switch to Plans.
- Click Create plan and select the site.
- Choose the protocol (Benthic transect, Fish transect, Tree growth, Fauna observation).
- Draw the observation units or upload geometry.
- Save the plan to reuse the same geometry across surveys.
Survey plans keep field protocols consistent across seasons and teams.
7) Create your first survey
- Return to Surveys and click Create survey.
- Choose Plan and select the plan you created.
- Set the survey date, team, and method settings.
- Start data entry and update the survey status as work progresses.
Survey status moves from In progress → In review → Completed. This keeps QA/QC visible to the whole team.
Where to find key pages
- Sites: view site boundaries, metadata, and monitoring summaries.
- Surveys: manage plans and field data entry.
- Analytics: review time series, satellite conditions, and metrics.
- Reports: compile surveys into standardized outputs.
- Organizations: manage team access and roles.
Data quality tips
- Reuse survey plans so geometry stays consistent.
- Use stable benthic codes and fish taxa lists to reduce cleanup later.
- Add field notes for visibility, weather, and access conditions.
- Review surveys in Analytics soon after fieldwork to catch gaps early.
Common issues
- No create buttons: your role may not allow editing.
- Boundary errors: polygons must be closed and inside the intended area.
- No satellite data yet: some sites need time to populate historical context.
MRV readiness and disclosure alignment
- Baseline vs repeat surveys: mark baselines and keep repeat surveys on comparable geometry.
- Monitoring plan logic: define cadence, QA/QC thresholds, and conservative handling of uncertainty.
- Outcome types and claims discipline: record uplift, avoided loss, or maintenance credits; separate inputs from verified outcomes.
- Rights and integrity: document FPIC, customary marine tenure, OECM, ICCA, benefit sharing, durability mechanisms, and leakage risk.
- Disclosure alignment: map indicators to TNFD, CSRD, ESRS, EU Taxonomy, SBTN, and SBTi requirements.
- Use the Metrics Reference and Data Providers for definitions and sources.