Generating Reports for Funders and Regulators
MariMap’s report builder helps you compile selected surveys, notes, and data into professional reports for funders, regulators, or partners. Choose projects and sites, filter by survey status and date range, and review the report preview before sharing. This guide explains how to create reports, track progress, and keep reporting consistent across monitoring cycles.
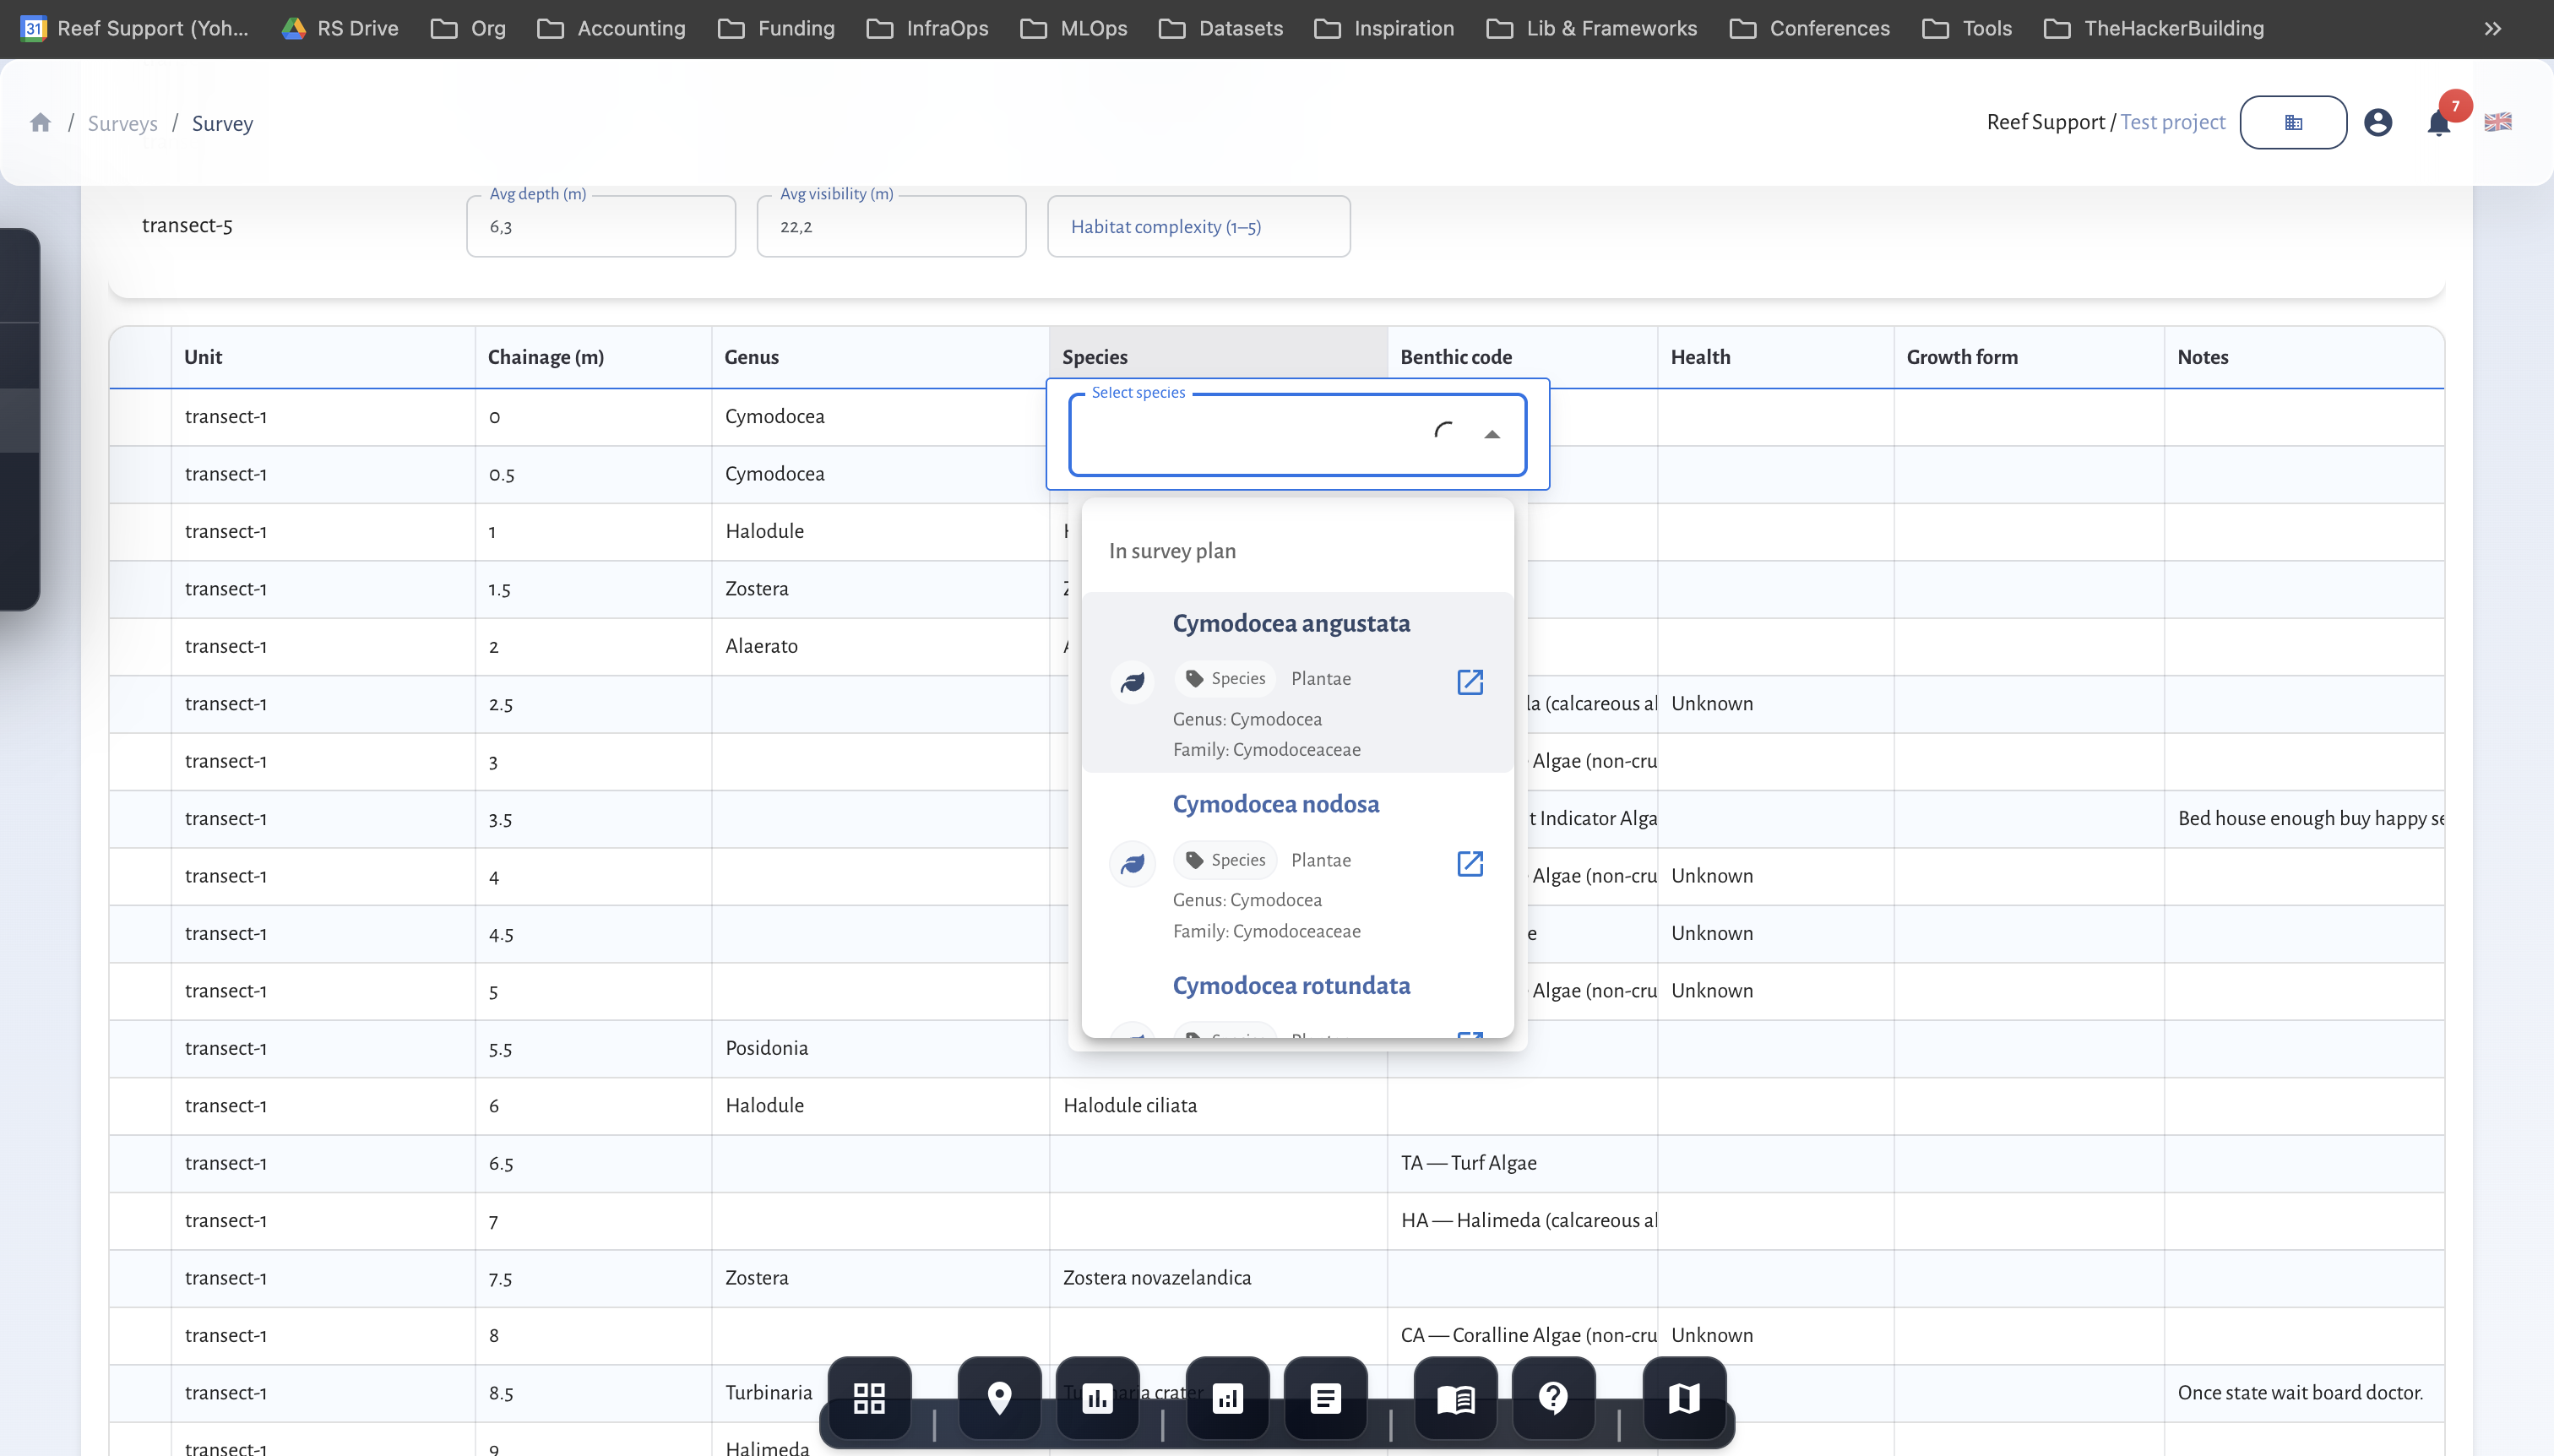 Validate included surveys and key metrics before sharing externally.
At a glance
- Reports pull surveys from selected projects and sites.
- You can filter by date range and survey status.
- Reports are generated in the Reports workspace.
- Report previews help validate content before sharing.
- Consistent project and site structure improves report quality.
Before you start
- Confirm surveys are marked Completed or In review.
- Ensure site boundaries and metadata are accurate.
- Decide the reporting period and target audience.
Report wizard overview
Report creation follows a short wizard: Report information → Surveys → Preview → Review. Use the Filters button in the report information step if you need to include surveys that are not yet completed.
Step-by-step in MariMap
1) Open Reports
- Go to Reports in the left navigation.
- Click Create report.
2) Define report basics
- Report name: use a name that matches the reporting period.
- Notes (optional): add context for reviewers.
3) Select project and site scope
- Choose the project(s) to include.
- If needed, narrow to specific sites.
This keeps the report aligned with the monitoring footprint.
4) Choose surveys and date range
- Select the survey date range.
- Choose whether to include only completed surveys.
- Review the list of surveys that match the filters.
5) Review the report preview
- Use the preview metrics to confirm key indicators.
- Check that the correct surveys are included.
- Adjust filters if anything is missing.
6) Generate the report
Create the report and wait for the status to update. Reports appear in the Reports list, and you can open them to view the final output.
Keeping reports consistent
- Use consistent project names and site IDs.
- Standardize survey plans and protocols across cycles.
- Capture field notes and QA/QC outcomes to support interpretation.
- Keep reporting periods consistent (monthly, quarterly, annual).
If data changes, regenerate
If you add surveys or fix QA/QC issues after creating a report, use Regenerate from the Reports list to refresh the output.
Reporting checklist
- Confirm projects and sites match the reporting scope.
- Use the same date range definitions across cycles.
- Keep survey status consistent (Completed vs In review).
- Add notes that explain anomalies or field constraints.
Common issues
- No surveys listed: check the date range and survey status filters.
- Missing sites: confirm the project scope includes those sites.
- Report stuck in pending: refresh the report page and try again later.
MRV readiness and disclosure alignment
- Baseline vs repeat surveys: mark baselines and keep repeat surveys on comparable geometry.
- Monitoring plan logic: define cadence, QA/QC thresholds, and conservative handling of uncertainty.
- Outcome types and claims discipline: record uplift, avoided loss, or maintenance credits; separate inputs from verified outcomes.
- Rights and integrity: document FPIC, customary marine tenure, OECM, ICCA, benefit sharing, durability mechanisms, and leakage risk.
- Disclosure alignment: map indicators to TNFD, CSRD, ESRS, EU Taxonomy, SBTN, and SBTi requirements.
- Use the Metrics Reference and Data Providers for definitions and sources.
Related guides
- Planning Surveys and Data Collection
- Coral Reef Monitoring in MariMap
- Team Collaboration and Permissions