Mangrove Monitoring in MariMap
Mangrove monitoring in MariMap uses repeatable survey methods so teams can track mangrove condition, structure, and change over time. Mangrove sites use Tree growth and Fauna observation protocols, with planned geometry that keeps plots and areas consistent across surveys. This guide shows how to set up mangrove monitoring, enter field observations, and interpret mangrove indicators alongside environmental context.
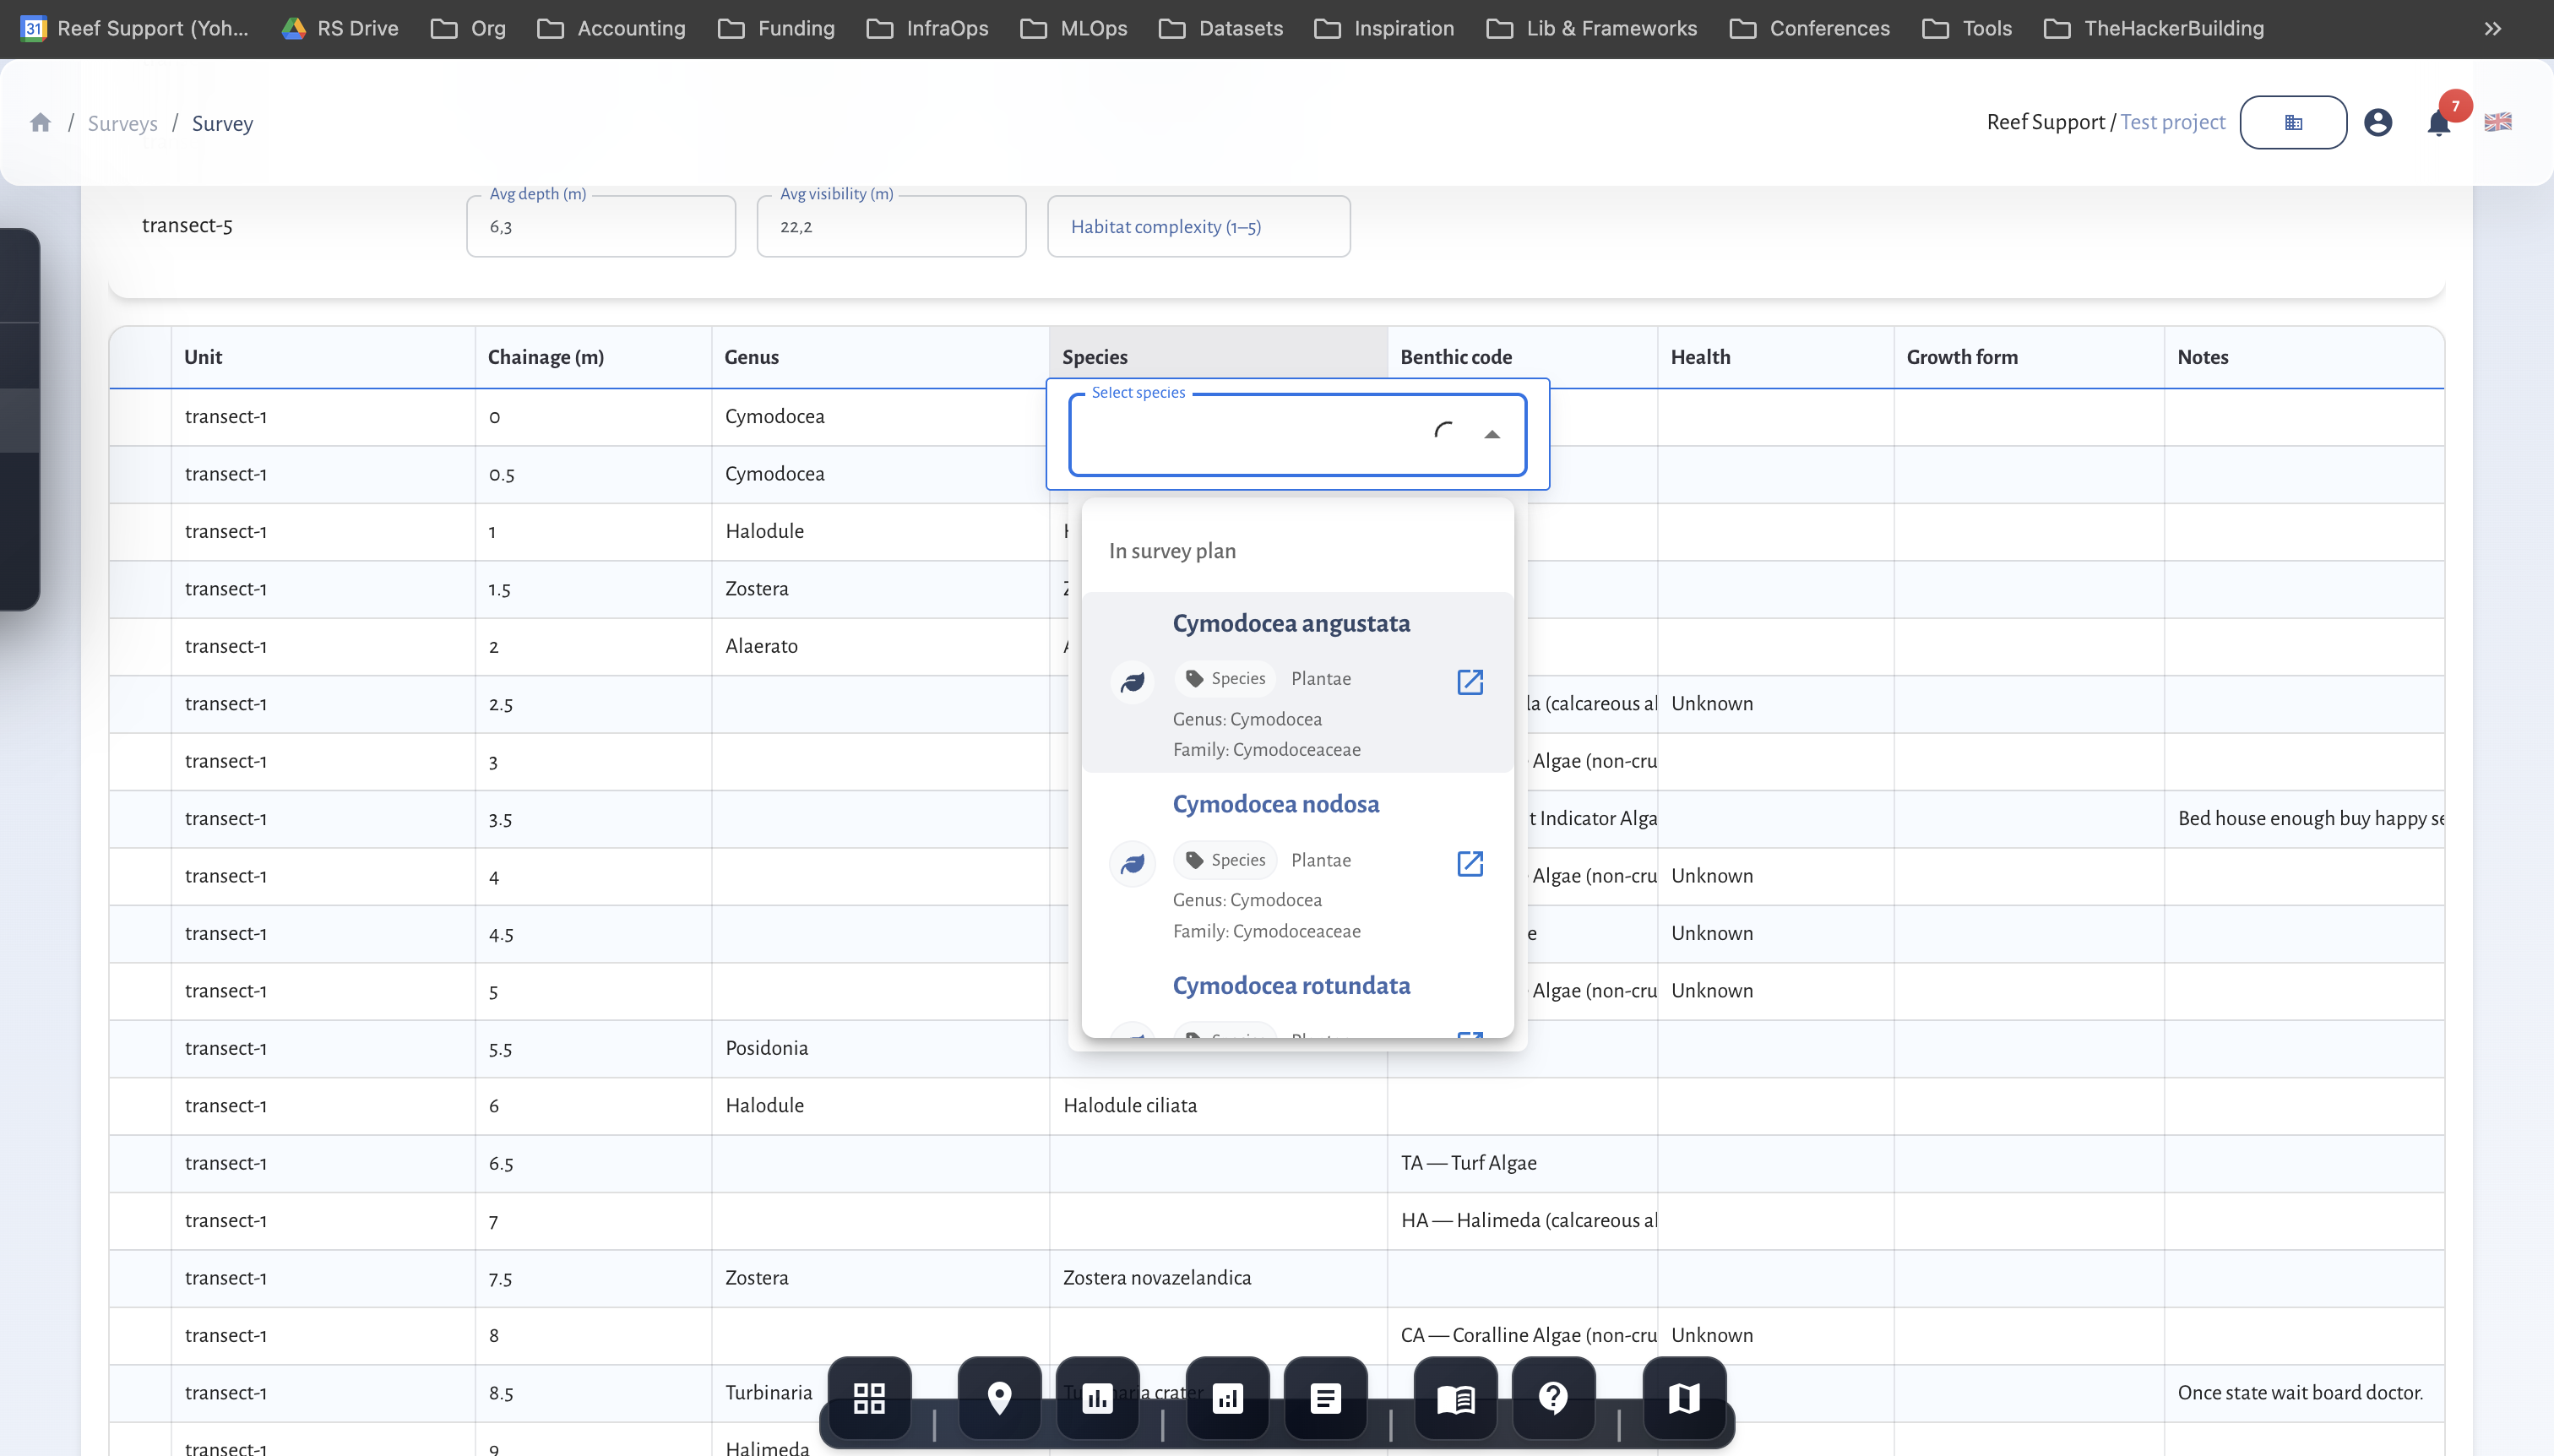
 Tree growth survey data entry in MariMap.
At a glance
- Mangrove monitoring in MariMap uses Tree growth and Fauna observation protocols.
- Plans keep plot geometry consistent so measurements are comparable over time.
- Tree growth surveys capture DBH, height, health, and species.
- Fauna observation surveys capture species presence and abundance.
- Monitoring metrics appear on the site Monitoring workspace and in Analytics.
Before you start
- Confirm the site type is Mangrove in the Site profile.
- Draw or upload a boundary that matches the mangrove extent.
- Decide whether your focus is structure, fauna, or both.
- Align on species lists and naming conventions for consistency.
Protocols available in MariMap
Tree growth
Tree growth surveys capture mangrove structure and growth measurements. In MariMap you define plots or transects and then record consistent measurements on each survey.
Common data captured: species, DBH, height, canopy notes, and field conditions.
Fauna observation
Fauna observation surveys capture presence and abundance of fauna associated with mangrove habitats.
Common data captured: species or genus, counts, and notes on habitat or behavior.
Choosing the right mangrove monitoring mix
- Forest structure focus: Tree growth surveys on consistent plots.
- Biodiversity focus: Fauna observation plus a smaller set of tree plots.
- Restoration monitoring: Repeat the same plots each season and track survival.
- Rapid checks: One protocol with clear notes and stable geometry.
Step-by-step in MariMap
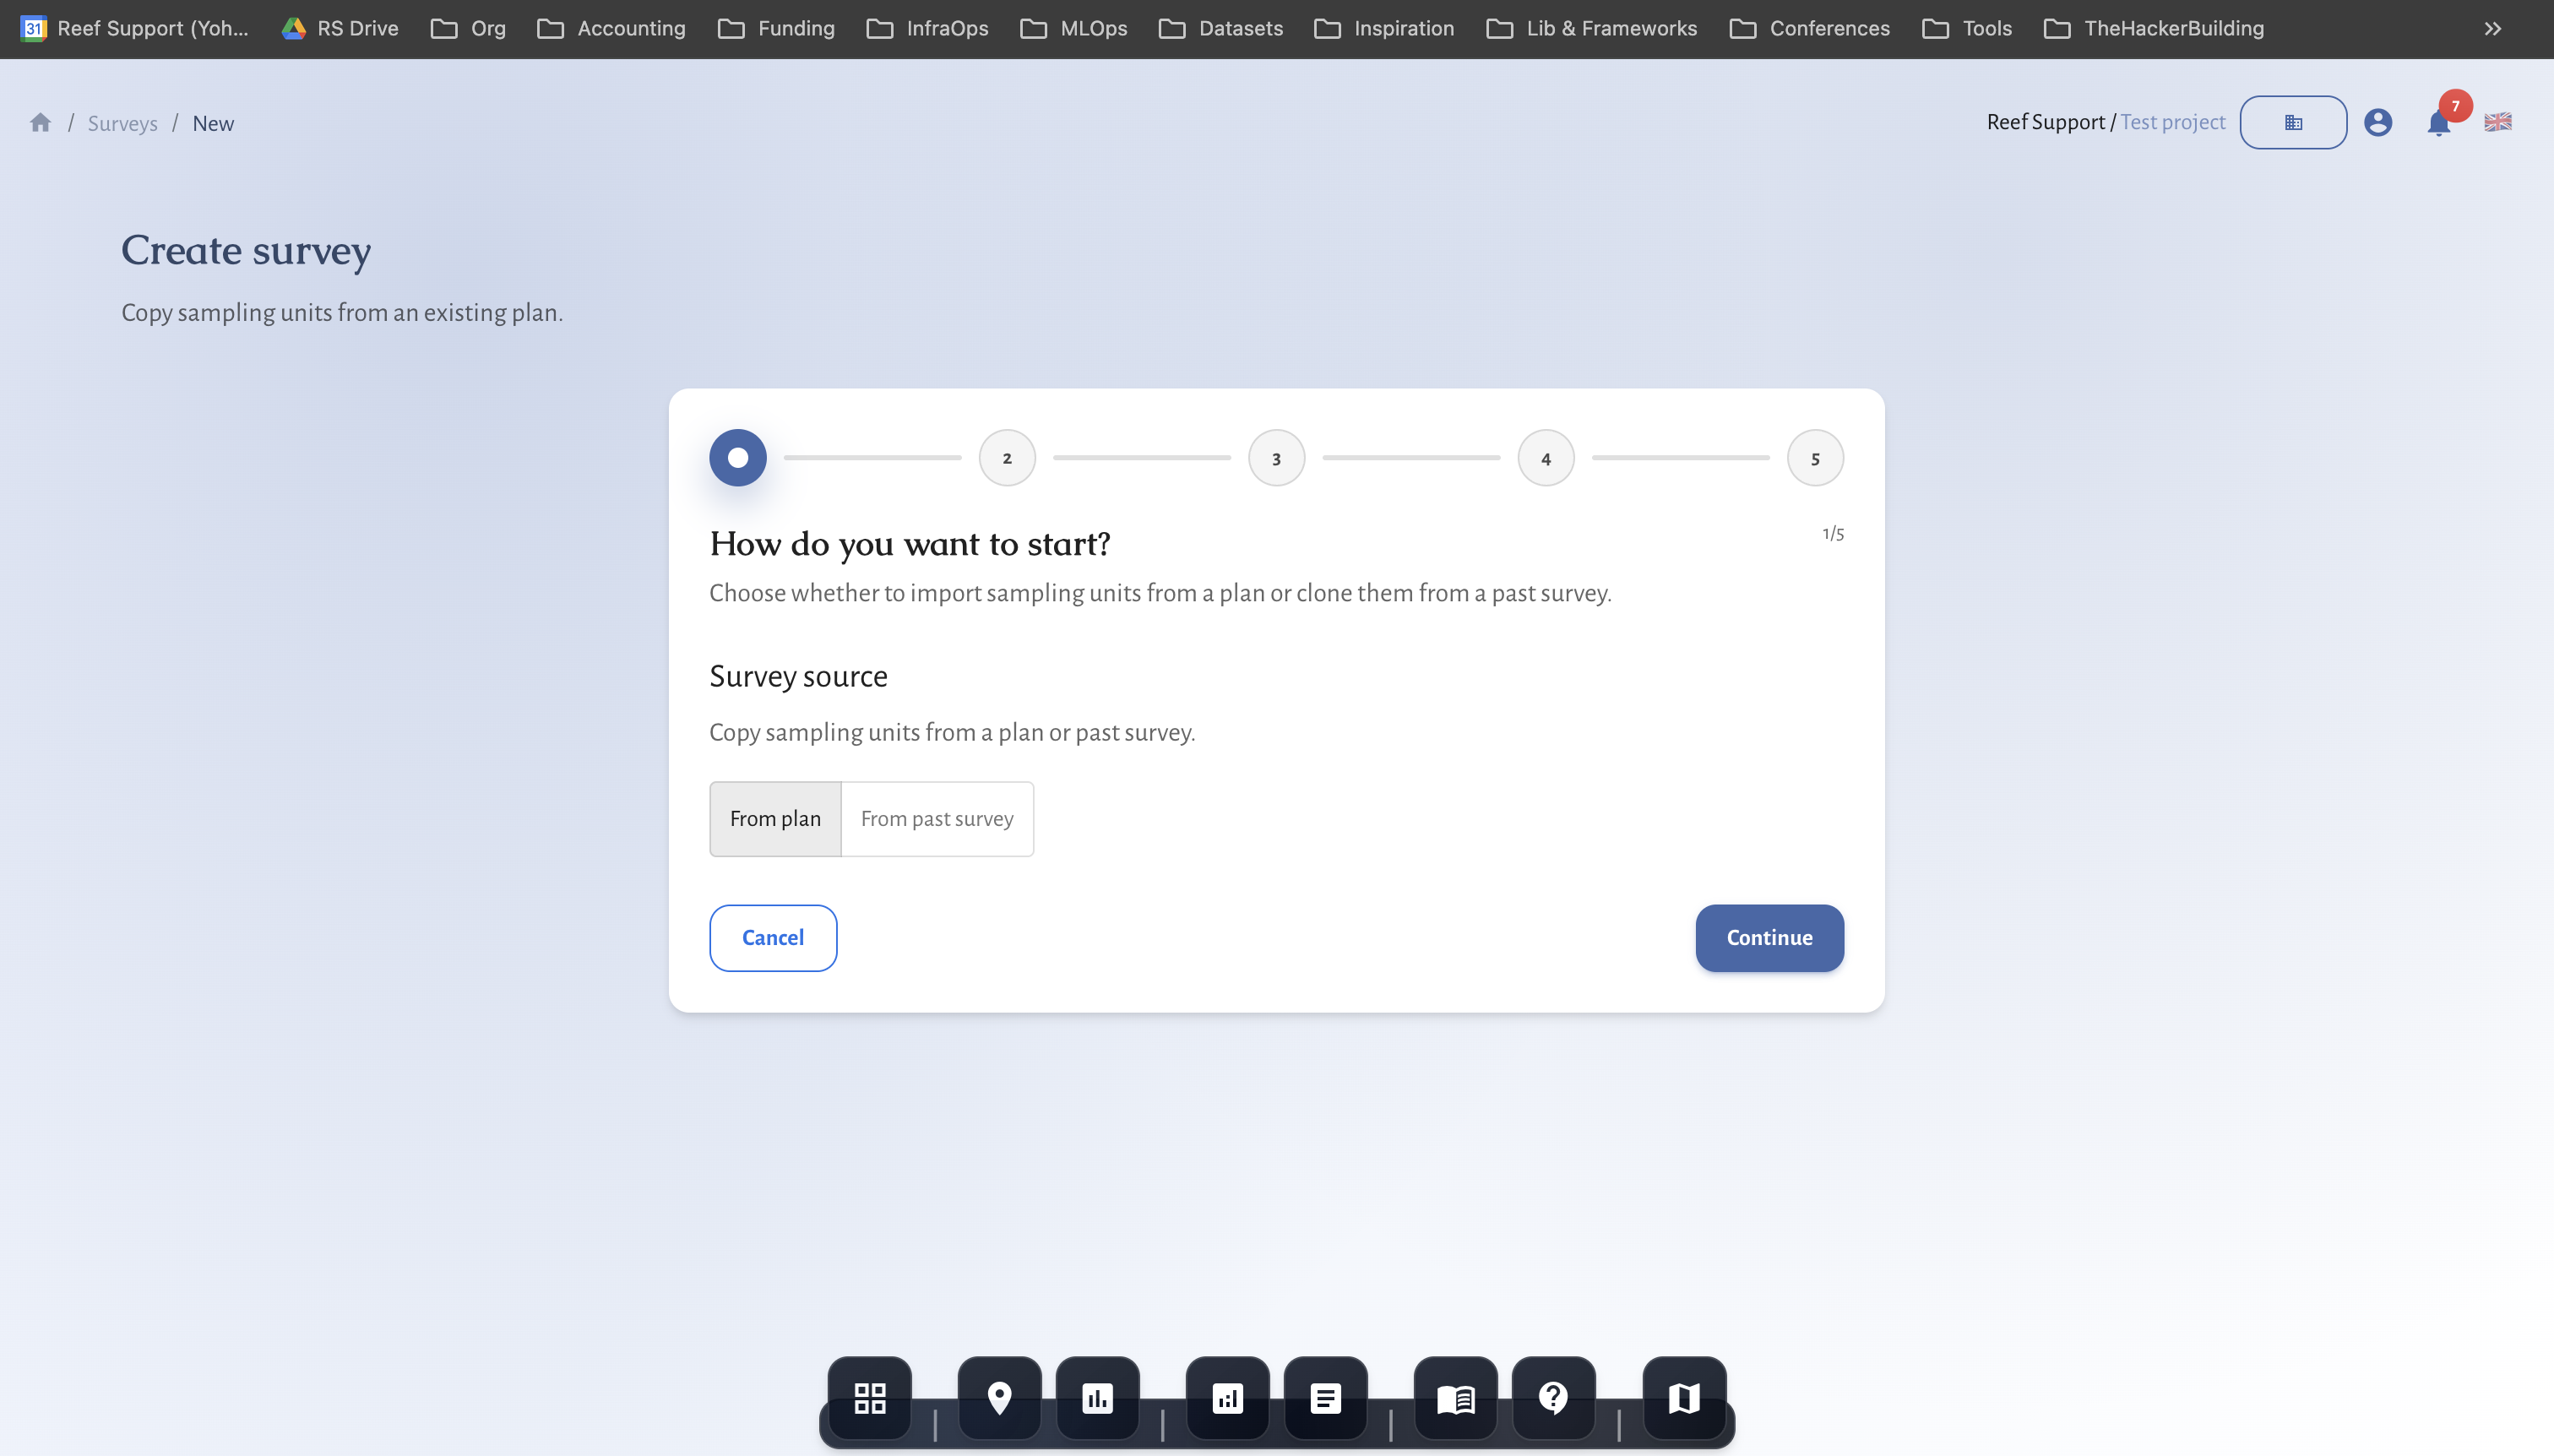
1) Create a survey plan
- Go to Surveys → Plans.
- Click Create plan and select the mangrove site.
- Choose Tree growth or Fauna observation.
- Draw plots or transects inside the site boundary.
- Save the plan so geometry is reused.
2) Configure survey details
- In Surveys, click Create survey.
- Choose Plan and select your plan.
- Confirm the survey date and team.
- Review any method defaults before starting data entry.
3) Collect and enter observations
- Enter tree measurements and health notes in the survey grid.
- For fauna observation, record species and counts consistently.
- Add notes on tides, flooding, or access conditions.
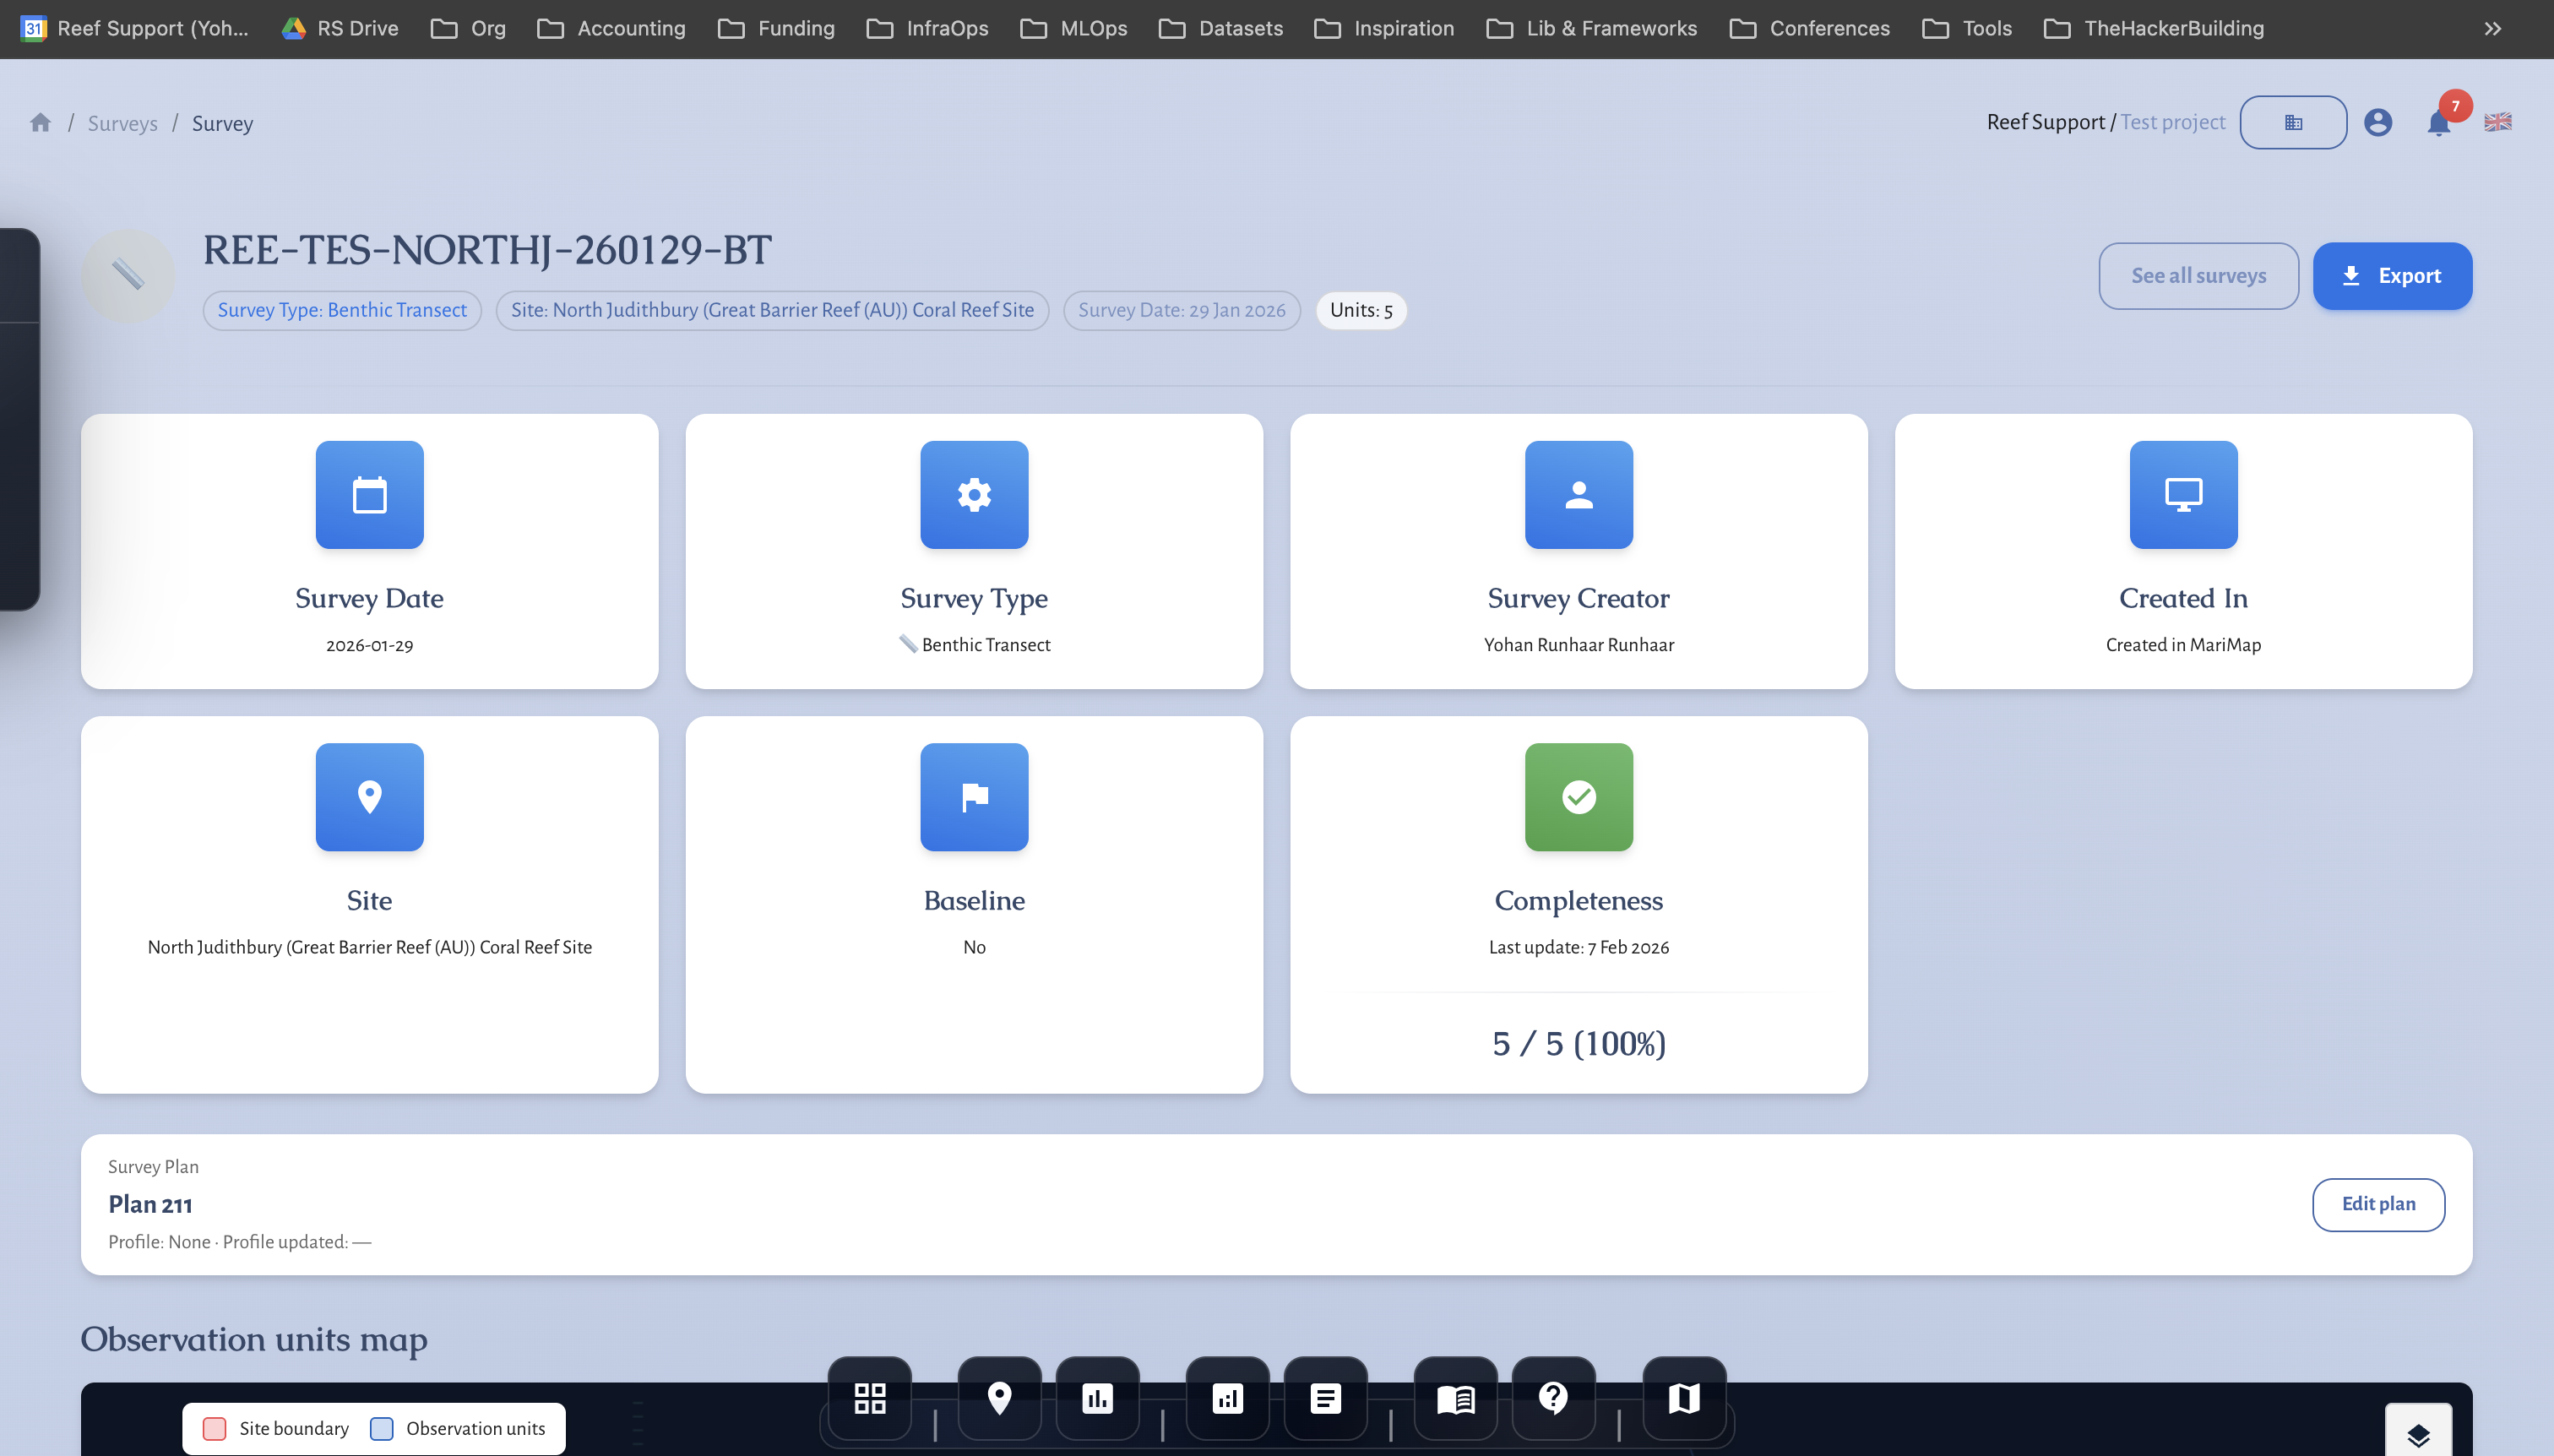
4) Review and complete the survey
- Update the Survey status from In progress → In review → Completed.
- Confirm any outliers or missing fields before closing the survey.
5) Review monitoring metrics
- Open the site page and scroll to Monitoring.
- Check Monitoring overview and Monitoring metrics for trends.
- Use Recent surveys to compare with previous seasons.
Interpreting mangrove monitoring results
Use tree growth data to track changes in structure and canopy condition over time. Use fauna observations to understand habitat use and biodiversity signals. The site environment section and Analytics help relate changes to temperature, rainfall, or coastal pressure.
Tips for consistent mangrove monitoring
- Keep plots stable and reuse the same plan each season.
- Use consistent species names and measurement units.
- Record field notes on access, flooding, or damage.
- Review metrics after each survey to catch gaps early.
Common issues
- No protocols shown: confirm the site type is Mangrove.
- Geometry errors: plots and transects must be inside the site boundary.
- Missing measurements: check required fields before completing the survey.
MRV readiness and disclosure alignment
- Baseline vs repeat surveys: mark baselines and keep repeat surveys on comparable geometry.
- Monitoring plan logic: define cadence, QA/QC thresholds, and conservative handling of uncertainty.
- Outcome types and claims discipline: record uplift, avoided loss, or maintenance credits; separate inputs from verified outcomes.
- Rights and integrity: document FPIC, customary marine tenure, OECM, ICCA, benefit sharing, durability mechanisms, and leakage risk.
- Disclosure alignment: map indicators to TNFD, CSRD, ESRS, EU Taxonomy, SBTN, and SBTi requirements.
- Use the Metrics Reference and Data Providers for definitions and sources.
Related guides
- Planning Surveys and Data Collection
- Understanding Satellite and Environmental Data
- Generating Reports for Funders and Regulators
References