Understanding Satellite and Environmental Data in MariMap
MariMap provides satellite and environmental data from NOAA Coral Reef Watch and Copernicus Marine Service, including sea surface temperature, salinity, chlorophyll, pH, currents, and heat stress indicators. This guide explains what data is available, how to interpret charts and condition categories, and how to use the environmental context to inform marine conservation decisions. All data sources are cited and linked to the MariMap references page.
 Use satellite layers and environmental context to interpret site conditions.
At a glance
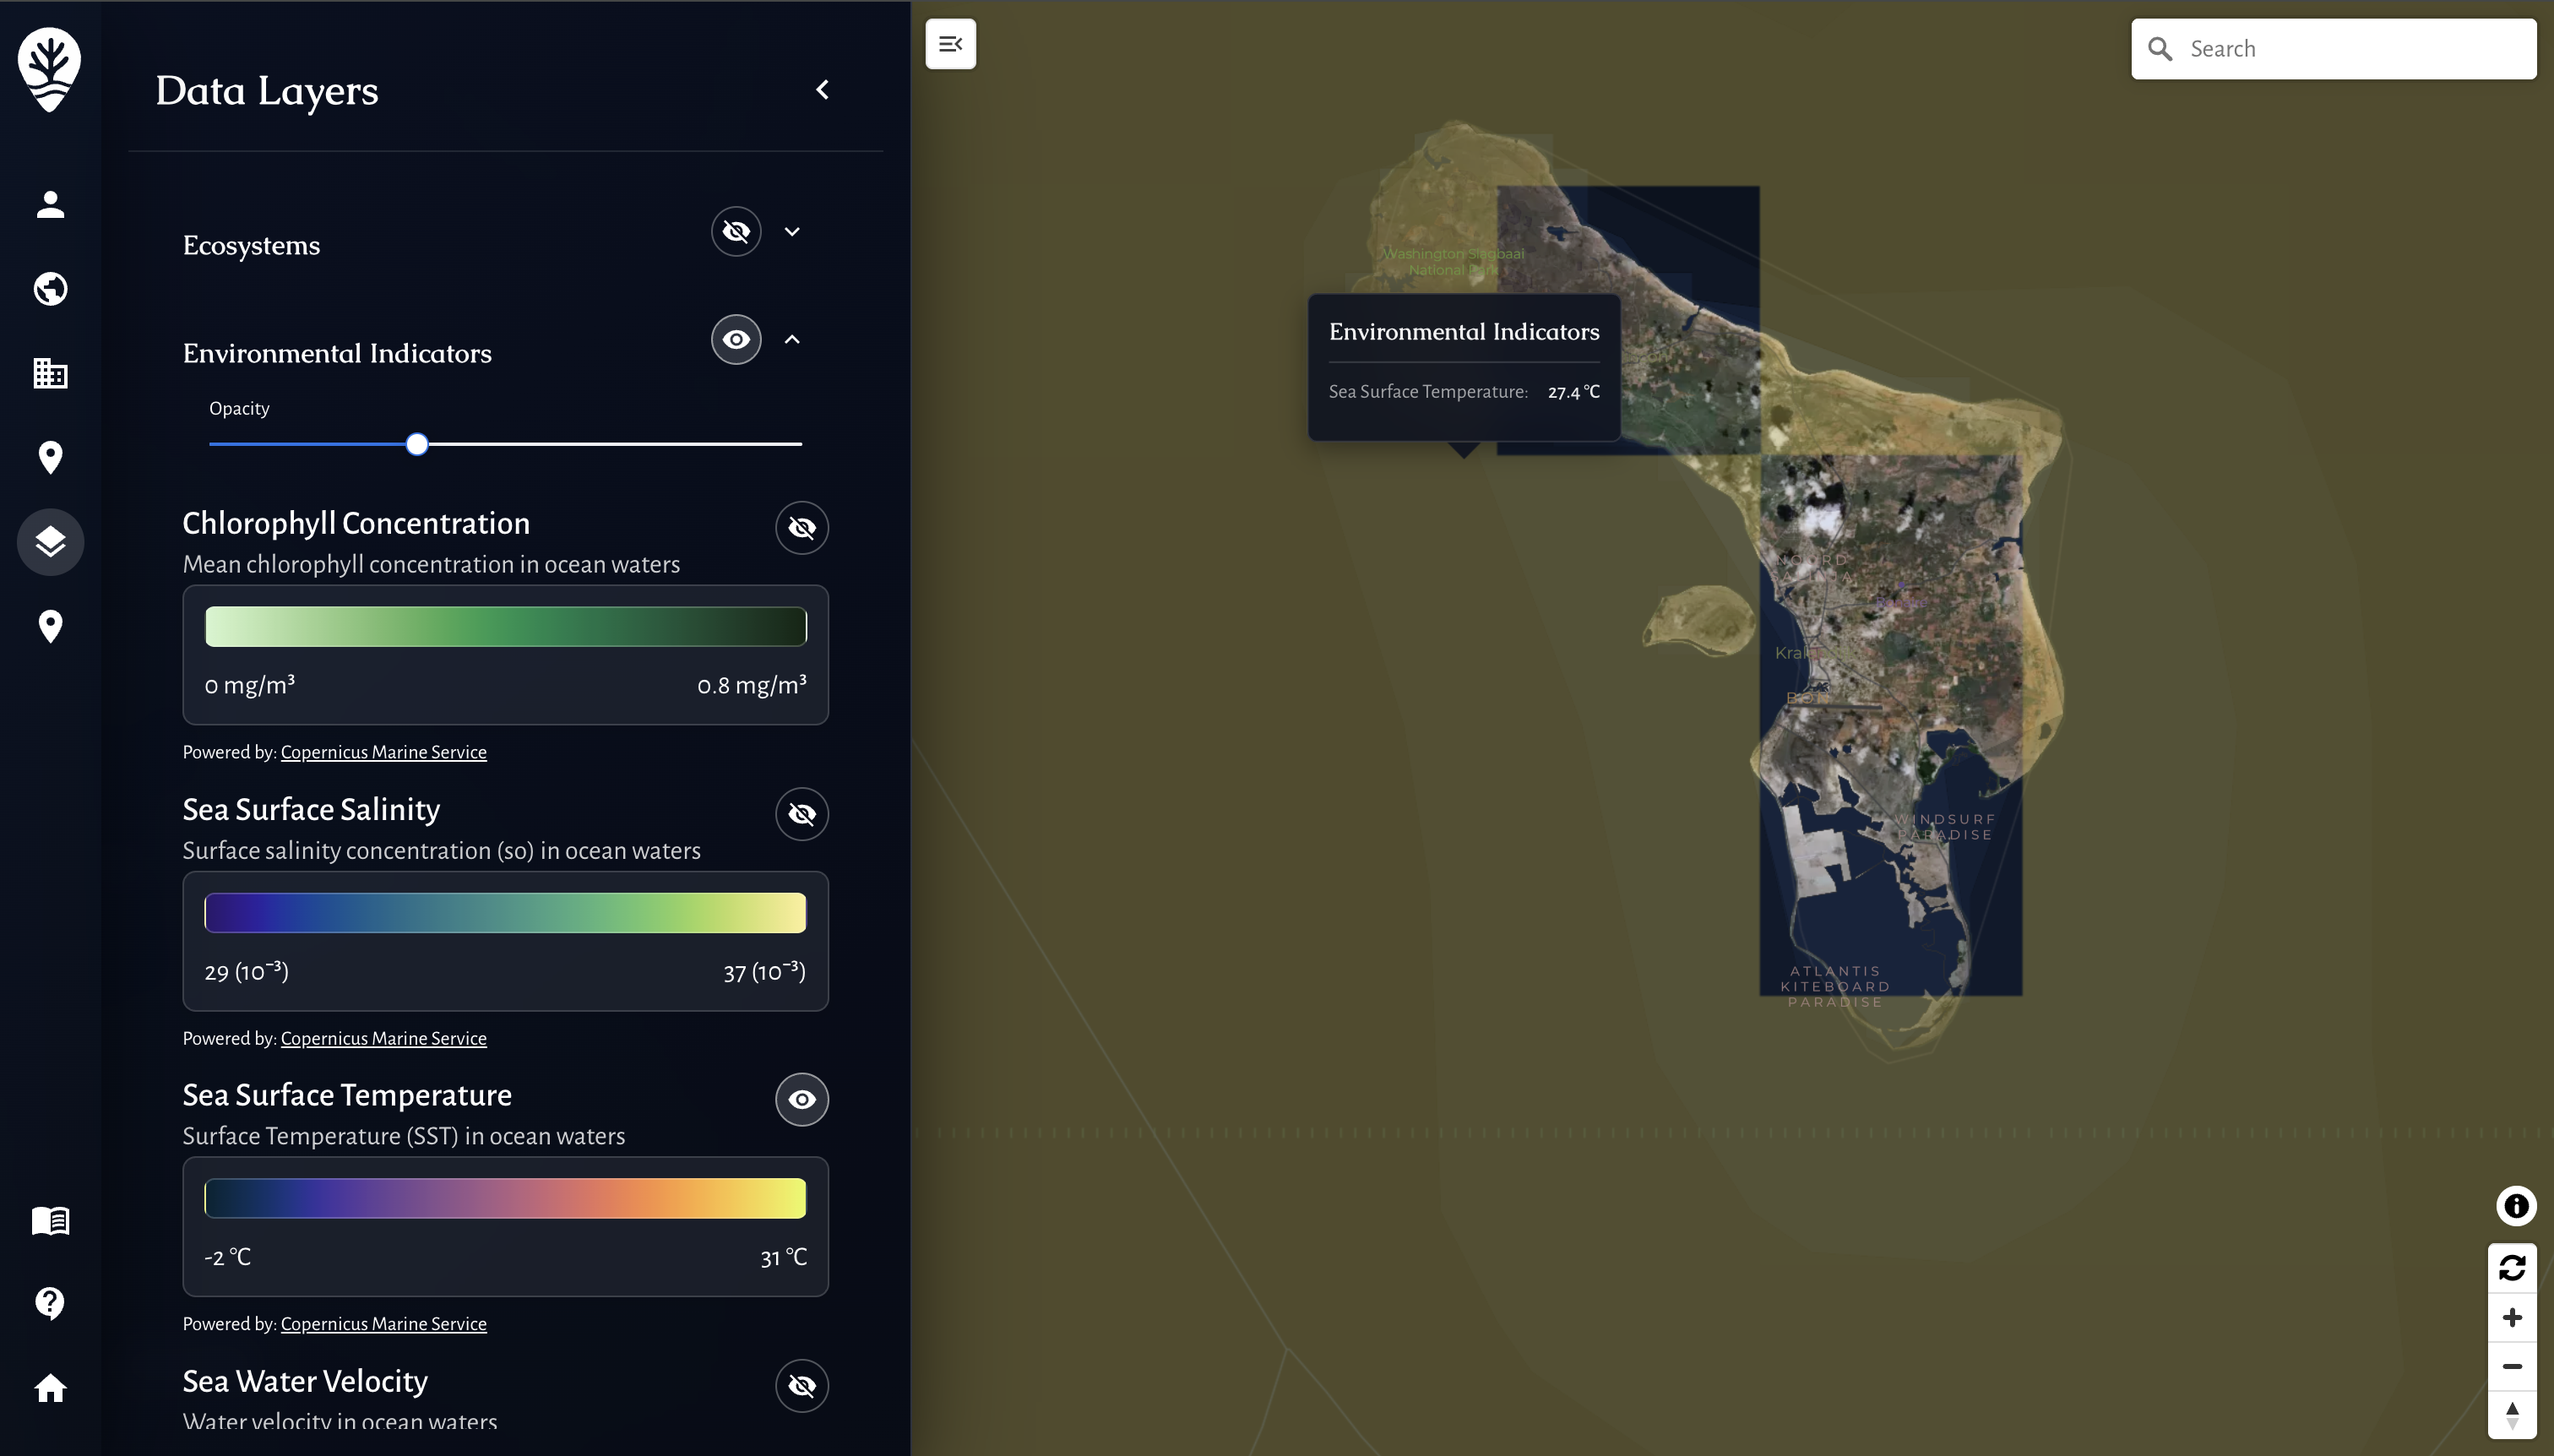
- Satellite data is linked to site boundaries and observation units.
- NOAA Coral Reef Watch provides reef-focused heat stress indicators.
- Copernicus Marine Service provides broader ocean parameters.
- condition categories help summarize how unusual current conditions are.
- Use environmental context to explain survey results and plan field work.
Where to find satellite data in MariMap
- Site page: open the site and use the Satellite time series tab.
- Analytics: review environmental trends alongside survey metrics.
- Maps: add environmental layers for regional context when available.
Satellite data is linked to the site boundary, so accurate site geometry improves context.
Data providers
NOAA Coral Reef Watch (NOAA CRW)
NOAA Coral Reef Watch provides global satellite heat stress products designed for coral reef monitoring.
Data available:
- Sea surface temperature (SST)
- SST anomaly
- HotSpot
- Degree Heating Week (DHW)
- Bleaching alert indicators
Best for: coral reef and seagrass sites.
References:
Copernicus Marine Service (CMEMS)
Copernicus Marine Service provides global ocean products for near-real-time and forecast ocean indicators.
Data available:
- Sea surface temperature (SST)
- Salinity
- Chlorophyll-a concentration
- pH
- Surface current speed
Best for: mangrove sites and broader ocean context.
References:
Coastal land and pressure layers
MariMap also connects to coastal land signals and human pressure layers where available.
References:
Understanding environmental condition categories
MariMap summarizes current conditions using simple categories per parameter: OK, WATCH, and ALERT. These categories are derived from a z-score comparison against a seasonal baseline (they are not a score).
Method summary:
- Baseline: 365-day lookback with a seasonal window.
- Z-score: (current value - baseline mean) / baseline standard deviation.
- Category thresholds:
- OK: |z| < 1
- WATCH: 1 ≤ |z| < 2
- ALERT: |z| ≥ 2
Use the category as a quick signal and always refer back to the raw values and local measurements.
Heat stress indicators
Maximum Monthly Mean (MMM)
The maximum of monthly mean SST values, used to calculate bleaching threshold.
Degree Heating Week (DHW)
Accumulated heat stress over rolling 7-day periods, measured in °C-weeks.
DHW is one of the most widely used coral bleaching risk indicators.
HotSpot
Temperature above the bleaching threshold. HotSpot helps identify rapid heat stress events.
Using environmental data for decision-making
Planning field work
- Avoid surveys during peak heat stress events.
- Plan baseline surveys before seasonal warming.
- Schedule restoration outplanting during stable conditions.
Interpreting survey results
- Compare coral cover changes with heat stress indicators.
- Use SST and chlorophyll to explain seasonal variation.
- Identify unusual conditions that may affect fish or benthic communities.
Reporting
Include environmental context in reports to explain observed trends. Satellite data helps funders and regulators interpret survey results accurately.
Common issues
- No data available: some sites need time to populate history.
- Facility sites: land-based facilities do not receive satellite data.
- Sparse signals: nearshore data can be noisy; use multiple indicators.
MRV readiness and disclosure alignment
- Baseline vs repeat surveys: mark baselines and keep repeat surveys on comparable geometry.
- Monitoring plan logic: define cadence, QA/QC thresholds, and conservative handling of uncertainty.
- Outcome types and claims discipline: record uplift, avoided loss, or maintenance credits; separate inputs from verified outcomes.
- Rights and integrity: document FPIC, customary marine tenure, OECM, ICCA, benefit sharing, durability mechanisms, and leakage risk.
- Disclosure alignment: map indicators to TNFD, CSRD, ESRS, EU Taxonomy, SBTN, and SBTi requirements.
- Use the Metrics Reference and Data Providers for definitions and sources.
Related guides
- Coral Reef Monitoring in MariMap
- Seagrass Monitoring in MariMap
- Mangrove Monitoring in MariMap
- Generating Reports for Funders and Regulators